Nikkei 225, FTSE 100, and S&P 500 Prices and Analysis
By Daniel M.
March 5, 2024 • Fact checked by Dumb Little Man

The Nikkei 225, FTSE 100, and S&P 500 indices are key indicators of global market trends, with recent activities showcasing significant movements. The Nikkei 225 notably crossed the 40,000 mark, propelled by tech and AI sector gains and a shift of investments towards Japan. The FTSE 100 is currently facing hurdles at crucial resistance levels, indicating market hesitancy. In contrast, the S&P 500 hit another record high, fueled by anticipation of economic updates and policy decisions. These trends reflect the dynamic nature of financial markets, responding swiftly to economic signals and policy changes.
The Nikkei 225 Surpasses 40,000 Mark Again

The Nikkei 225 has achieved a new milestone by crossing the 40,000 threshold once more, driven by a surge in tech and AI stocks like Tokyo Electron. This surge is attributed to a trend towards tech nearshoring and a shift of foreign investment from Chinese to Japanese markets. However, potential fluctuations in China's economy, a stronger yen, and policy shifts from the Bank of Japan pose risks to its continued ascent. The index may face a slight pullback towards the 23 February high of 39,638, with the 1989 peak of 38,957 serving as a further point of retracement.
FTSE 100 Struggles to Breach Key Resistance Levels
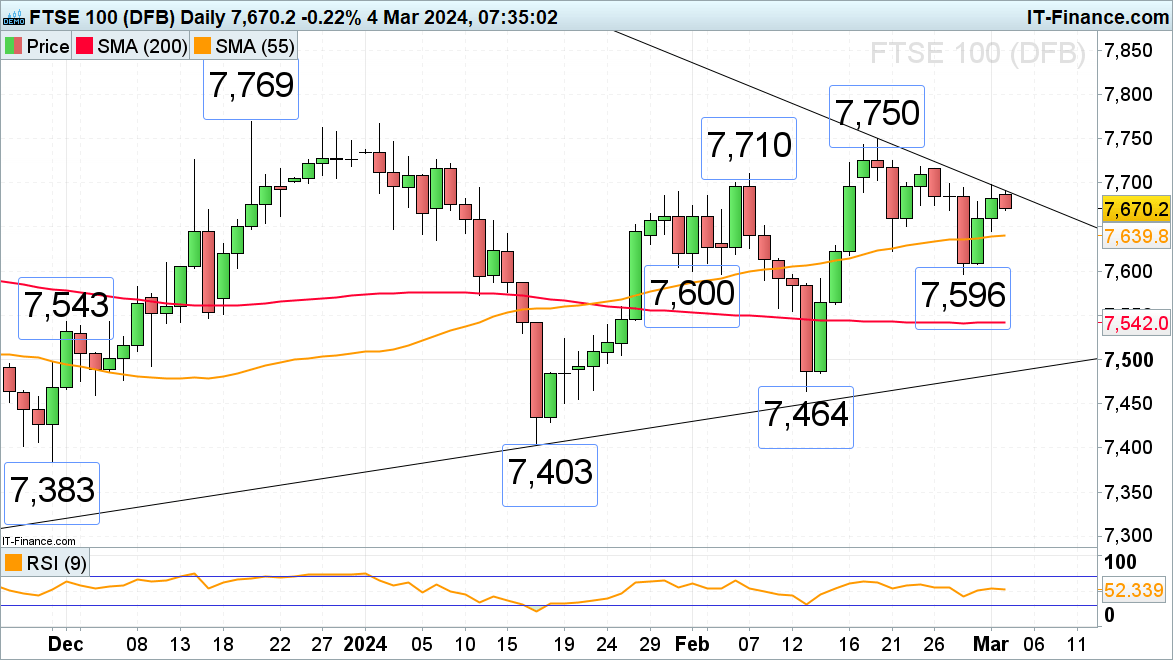
The FTSE 100's attempt to recover from its recent low of 7,596 has stalled before reaching the early February high of 7,710. Overcoming this hurdle and the 23 February high of 7,717 is essential to target the significant resistance zone between 7,750 and 7,769, marked by the highs from December to February. Near-term support is identified between the recent low and the 55-day SMA at 7,645 to 7,640.
S&P 500 Sets Another Record High
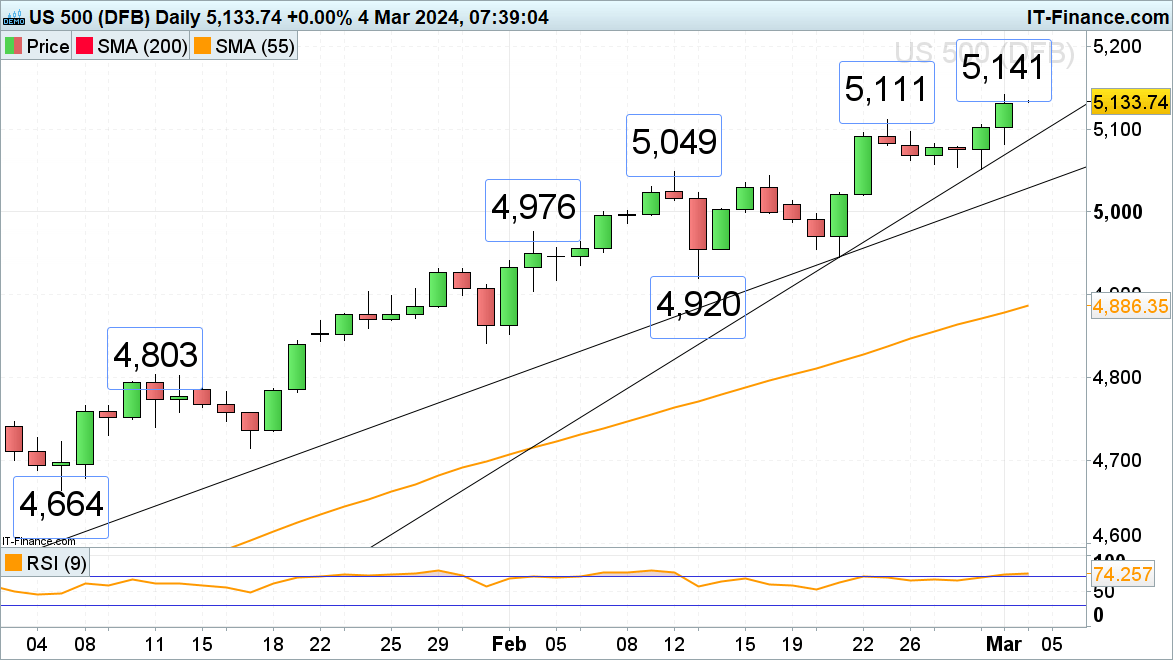
The S&P 500 continued its upward trajectory, nearing the 5,150 mark and setting a new record high in anticipation of Fed Chair Jerome Powell's upcoming testimony and U.S. labor market data. The next target is the 5,200 area, with support found around the 23 February high at 5,111. A fallback to the tentative uptrend line from February to March is seen at 5,088, should there be a downturn.
Final Thoughts
In summary, the Nikkei 225's breakthrough, the FTSE 100's resistance challenges, and the S&P 500's record highs illustrate the vibrant and interconnected dynamics of global markets. These movements reflect shifting investor sentiment and the impact of economic and policy indicators. The contrast between the indices highlights the diverse factors influencing market trends, emphasizing the importance of monitoring global economic signals for informed investment decisions.
Daniel M.
Daniel Moore is a seasoned trading analyst with over 20 years of experience navigating the ever-evolving financial landscape. Renowned for his unconventional yet effective approach, Daniel utilizes a blend of technical and fundamental analysis to identify hidden gems and craft winning trade strategies. He is a master at demystifying complex market data and translating it into actionable insights for traders of all experience levels.

