The Interplay of Resistances and Market Gaps: What’s Next?
Last week witnessed a surge in crude oil prices, breaking through the $80 mark and stretching the limits of its very short-term trading channel. But how did natural gas fare in comparison?
Did the bulls maintain their momentum, or did the bears retake the market floor? Insights from Friday’s Oil Trading Alert are unveiled below.
In-Depth Analysis: Natural Gas Daily Chart Dynamics
Technical Insights on Natural Gas
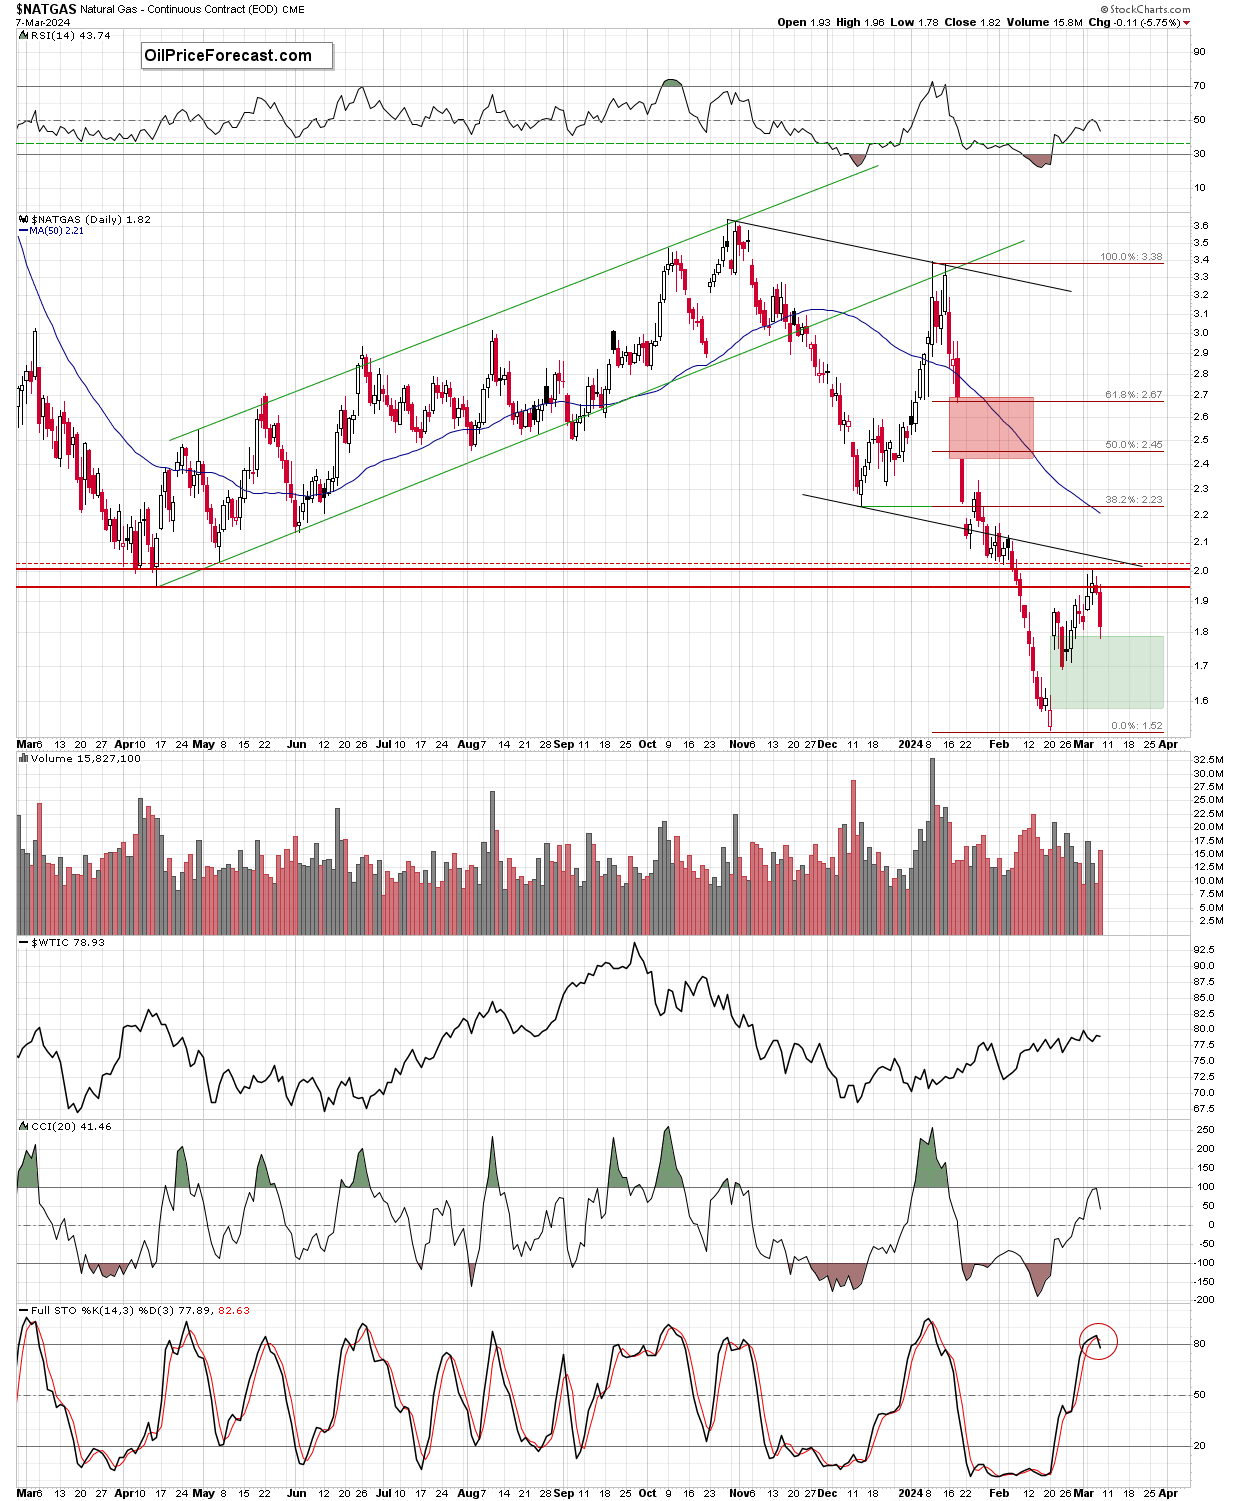
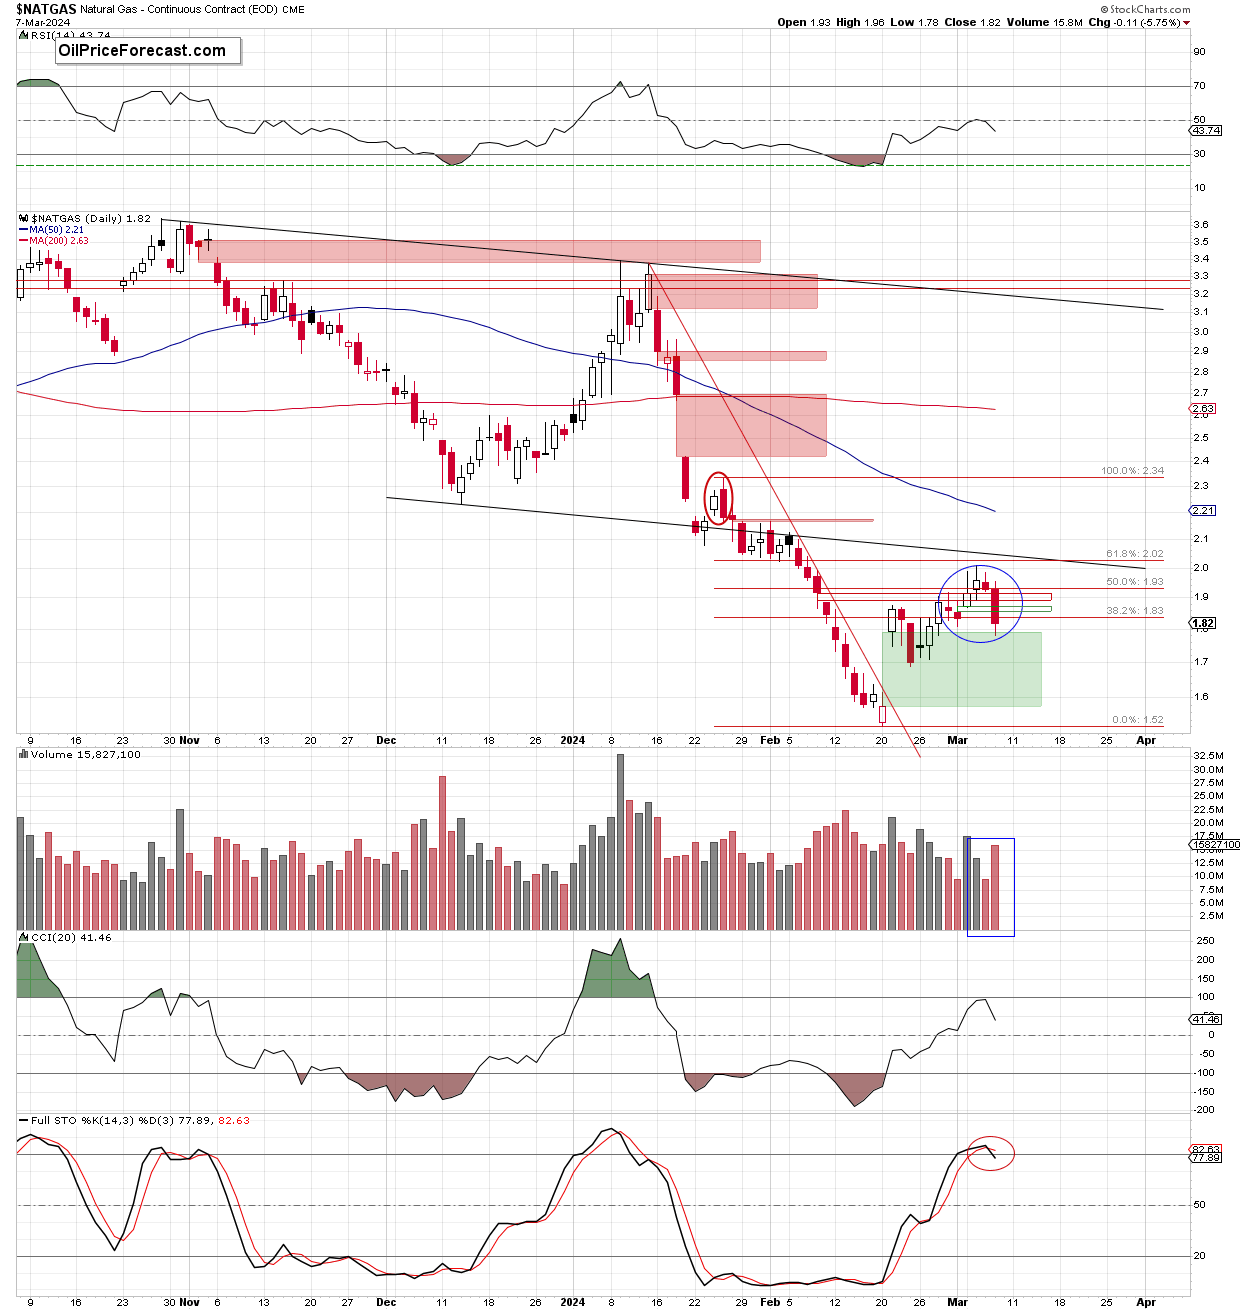
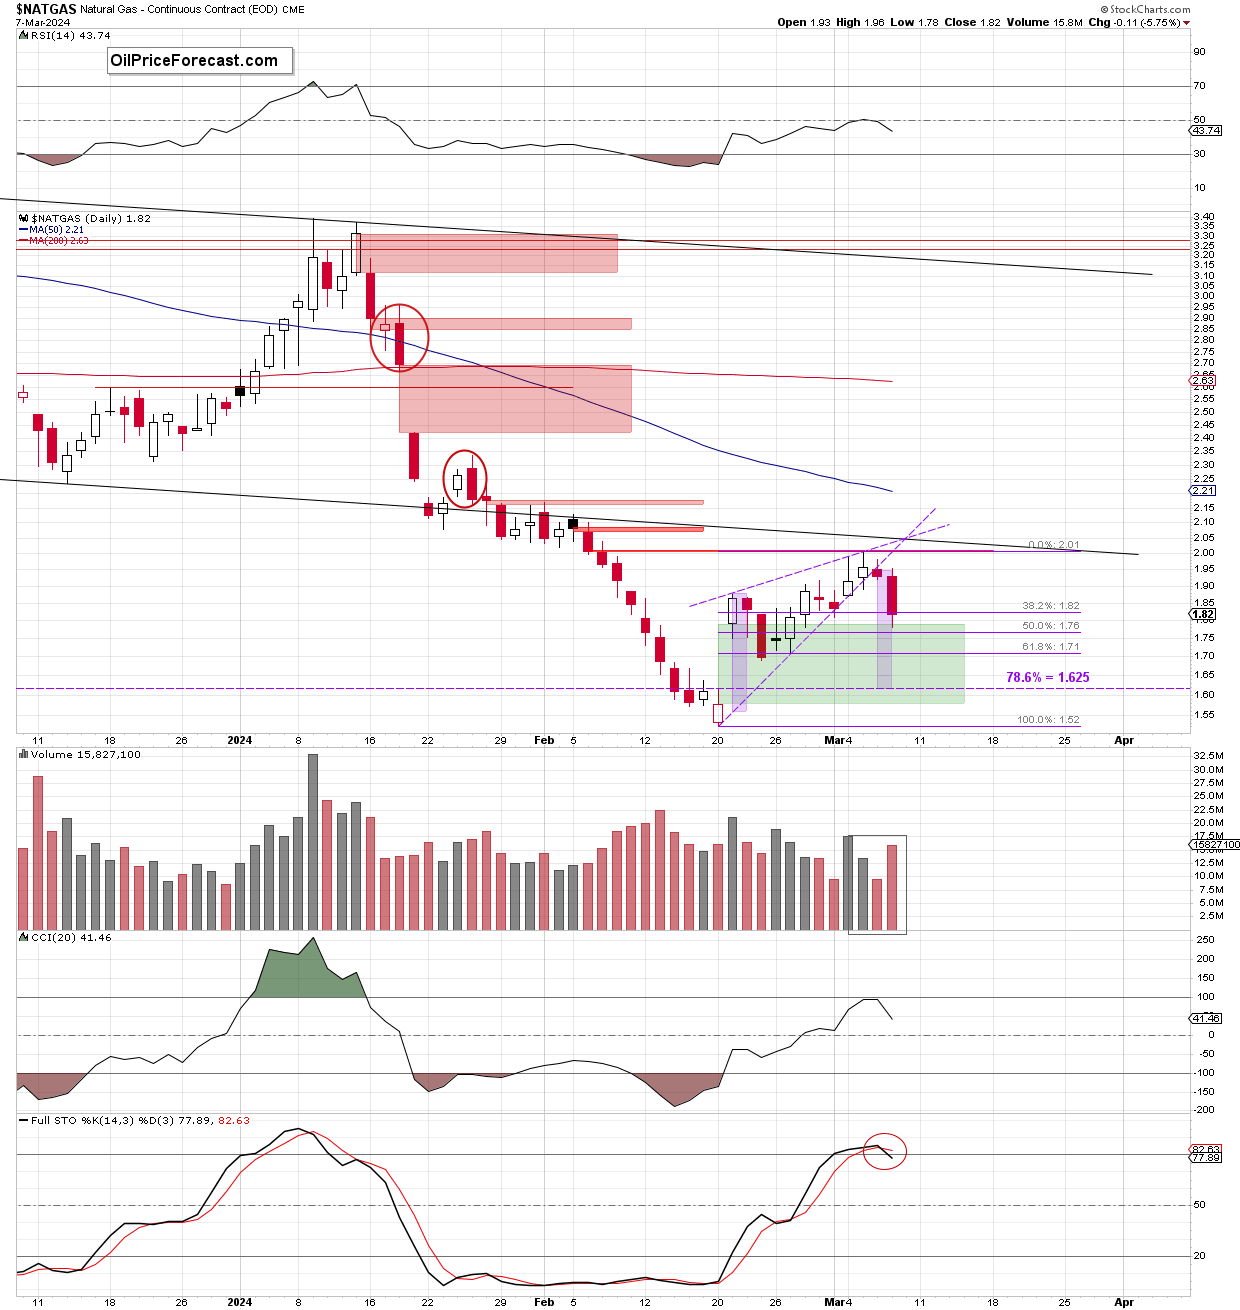
Upon closer examination of the natural gas daily chart, it becomes evident that the April 2023 lows—highlighted by intraday lows, daily openings, and closures depicted with red horizontal lines—alongside the near approach to the previously breached lower edge of the short-term black channel and the 61.8% Fibonacci retracement level, effectively halted the bullish advancement earlier this week.
The resultant bearish enticement has led to a price reversal in natural gas, culminating in a Wednesday close below the purple rising wedge’s lower boundary.
Consequences of the Bearish Shift
Understanding the Impact
This bearish momentum propelled natural gas into further losses in the subsequent session, marking a 5.75% decline and effectively closing the supportive green gap established on March 4.
The session’s downturn also flirted with the upper boundary of the February 21 green gap (1.576-1.792), prompting a modest bullish rebound before day’s end.
Despite this slight recovery, the breach below the purple wedge’s lower boundary suggests a potential fall towards the 1.625 level, aligning with the formation’s height and nearing the 78.6% Fibonacci retracement level, potentially offering a pause in the bearish trend in the upcoming week.
Prospects of Continued Deterioration
With daily indicators such as the CCI heading southwards post-overbought territory and the Stochastic Oscillator signaling a sell, coupled with a notable increase in volume accompanying the recent decline, the indicators point towards a likely continuation of the downward trajectory.
Conclusion: A Bearish Outlook for Natural Gas
Despite a temporary easing of losses, the confluence of resistance levels has effectively curbed bullish attempts, driving prices below the pivotal purple rising wedge. This, combined with increased trading volume and bearish daily indicator signals, sets the stage for further declines in natural gas prices in the near term.
Conversely, the recent uptick in crude oil prices has bolstered profits on my existing trades, with promising signs of additional gains in the days ahead.