Nasdaq 100: Bullish Reversal Supported by 10-Year T-Note Futures
By Daniel M.
January 5, 2025 • Fact checked by Dumb Little Man

Major Influence of 10-Year US Treasury Yield
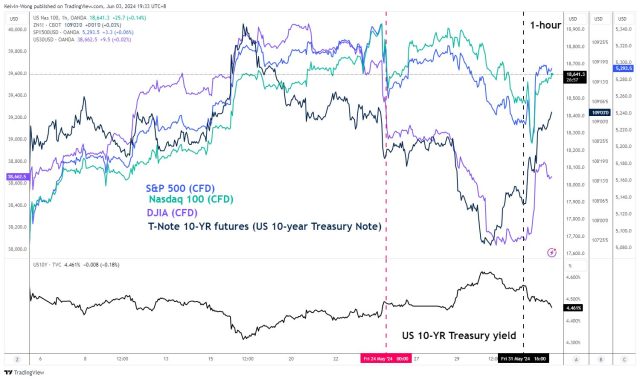
The 10-year US Treasury yield has become a key factor in dictating the short to medium-term movements of major US stock indices. On May 31, key intraday bullish reversals in the S&P 500, Nasdaq 100, and Dow Jones were driven by an earlier rally in the 10-year Treasury Note futures that began in the European session.
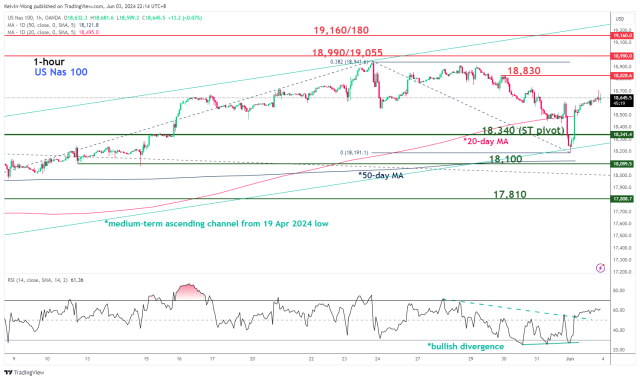
Watch the key short-term support level of 18,340 on the Nasdaq 100. The Nasdaq 100 reached a fresh intraday all-time high of 18,907 on May 23, boosted by Nvidia's strong Q1 earnings and optimistic Q2 revenue guidance.
Impact of Momentum and Earnings on Market Trends
While firm-based earnings are significant, the macro factor has now taken the lead since May 24. This can be understood by examining the movements of the 10-year US Treasury yield and major US stock indices. From May 24 to May 29, the 10-year Treasury yield rose by 15 basis points to a four-week high of 4.62%. During the same period, major US stock indices declined: S&P 500 (-1.31%), Nasdaq 100 (-1.43%), and Dow Jones (-2.45%).
Why Higher US Treasury Yields Affect Stocks

Last Friday's key bullish reversal in US stock indices was led by 10-year US Treasury Note futures
Higher US Treasury yields can negatively impact US stock indices. A rise in longer-term US Treasury yields, especially above the 5% resistance level, can trigger risk-off behavior among market participants. This leads to higher borrowing costs for consumers and corporations, potentially reducing profit margins and the number of earnings upgrades from analysts.
Additionally, the S&P 500's current 12-month forward P/E ratio of 20.3, above its 10-year average of 17.8, might be hard to sustain if the 10-year yield continues to rise. A shrinking equity risk premium, comparing the S&P 500 earnings yield against the 10-year yield, could make US equities less attractive compared to Treasury bonds.
Intraday Bullish Reversals and Positive Momentum

On May 31, major US stock indices erased intraday losses and rallied strongly into the close, with gains recorded in the S&P 500 (+0.80%) and Dow Jones (+1.51%), while the Nasdaq 100 recovered from an earlier loss. These bullish moves were led by a reversal in the 10-year US Treasury Note futures, which saw a rise in price due to a reduction in the 10-year yield (see Fig 1).
Analyzing Momentum in 10-Year Treasury Note Futures
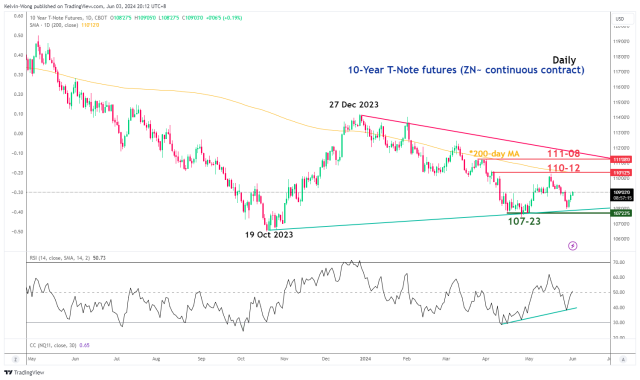
The 10-year US Treasury Note futures' movement is crucial due to its direct correlation with major US stock indices. The daily RSI momentum indicator for the futures shows “higher lows” and has not reached the overbought region, suggesting potential bullish momentum (see Fig 2).
If the medium-term support at 107-23 holds, the next resistance levels are at 110.12 (200-day moving average) and 111-08 (descending trendline since Dec 27, 2023).
Nasdaq 100 Rebounds Above Key Average


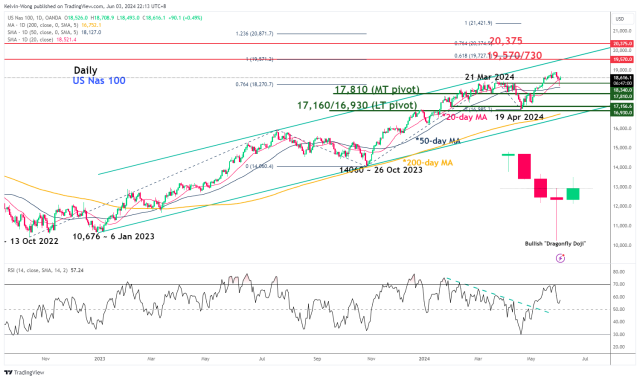
The Nasdaq 100 managed to trade above the 20-day moving average on May 31, forming a bullish “Dragonfly Doji” candlestick pattern, indicating a potential revival of its bullish trend since April 18, 2024 (see Fig 3).
Key Levels to Watch on Nasdaq 100
Monitor the 18,340 short-term pivotal support. A move above the 18,830 resistance could target intermediate resistances at 18,990/19,055 and 19,160/19,180 (see Fig 4).
On the downside, failure to hold at 18,340 may lead to a decline towards 18,100 (50-day moving average) and further to 17,810 as the key medium-term support.
Daniel M.
Daniel Moore is a seasoned trading analyst with over 20 years of experience navigating the ever-evolving financial landscape. Renowned for his unconventional yet effective approach, Daniel utilizes a blend of technical and fundamental analysis to identify hidden gems and craft winning trade strategies. He is a master at demystifying complex market data and translating it into actionable insights for traders of all experience levels.


