Last week was marked by significant market fluctuations due to hedging flows, with implied volatility measures like the VIX fluctuating wildly. As a result, it was challenging to interpret the underlying market sentiment.
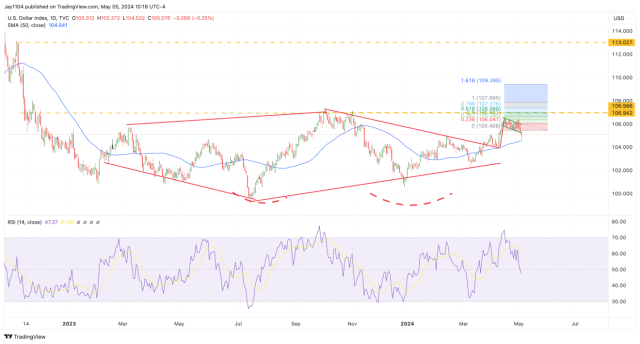
Friday was particularly frustrating because, despite the equity market rallying by 1% as expected due to short-term implied volatility levels, interest rates remained stable and the dollar weakened. This was contrary to expectations. Reviewing the charts over the weekend revealed interesting patterns. The DXY broke its bull flag pattern and hit the 50-day moving average before rebounding.
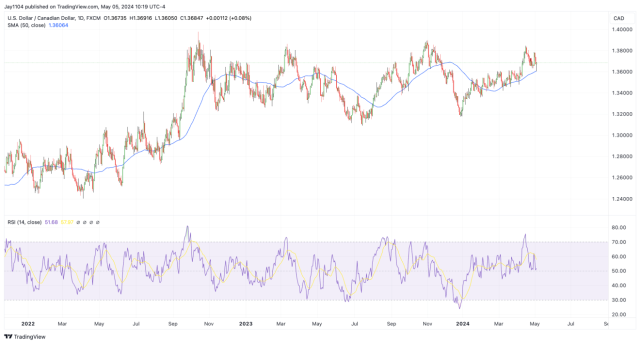
The USD/CAD exhibited a similar pattern, falling to the 50-day moving average before recovering to close higher.
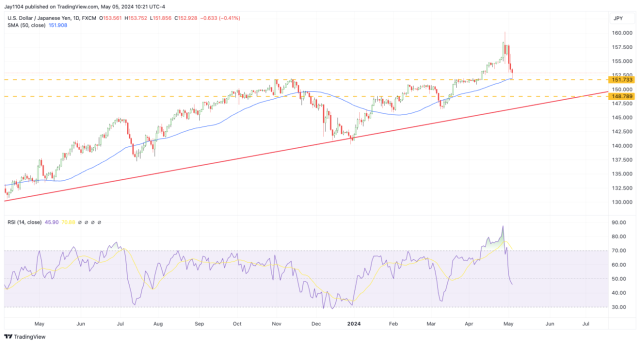
Even the USD/JPY showed this trend, which is surprising given the interventions by Japan’s Ministry of Finance and the Bank of Japan.
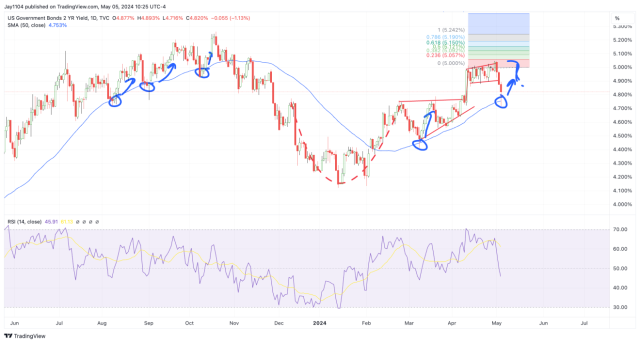
The 2-year Treasury yield also found support at the 50-day moving average. In the past, this pattern has often been a precursor to new highs, though it's not guaranteed.
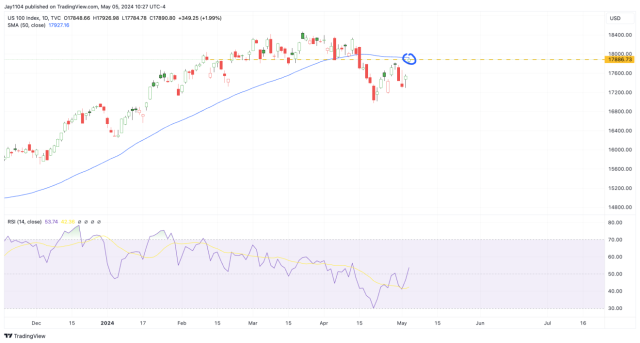
On Friday, the NASDAQ 100 encountered resistance at the 50-day moving average.
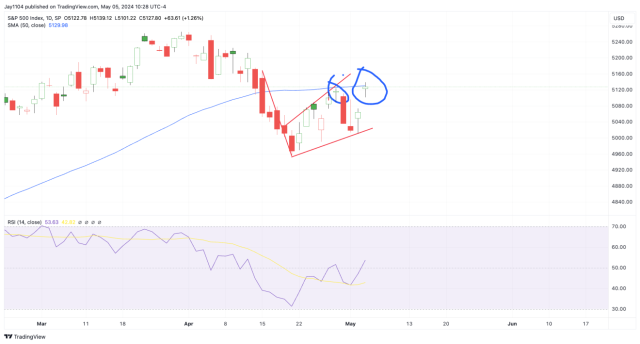
The S&P 500 also hit the 50-day moving average, showing a similar trend.
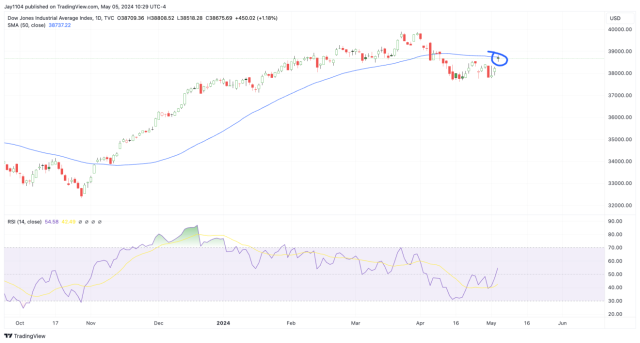
The Dow Jones Industrial Average reflected this pattern too.
Positioning had a significant impact on last week's results, particularly for those anticipating a hawkish Fed and strong jobs report. Historically, algorithms rely heavily on these moving averages. Powell didn't need to adopt a more hawkish stance, instead relying on other Fed speakers and data to guide market sentiment.
The Fed acknowledged inflation has stalled, meaning rate cuts will be delayed. This week's speeches could underscore fewer cuts or none at all, likely pushing the June meeting forecasts higher.
The jobs data might have been skewed by seasonal hiring patterns due to Easter falling in March. Typically, hiring in April happened in March, inflating that month's figures and deflating April's numbers.
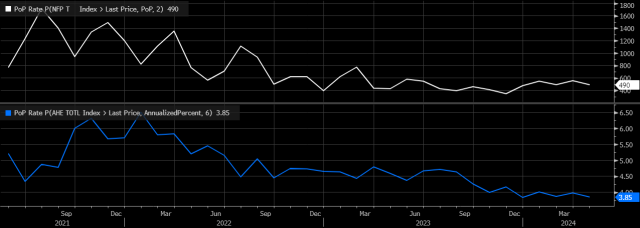
The two-month nonfarm payrolls rate of change showed a slight decline but remained within its recent range since December. The six-month annualized rate of wage growth has also remained stable.
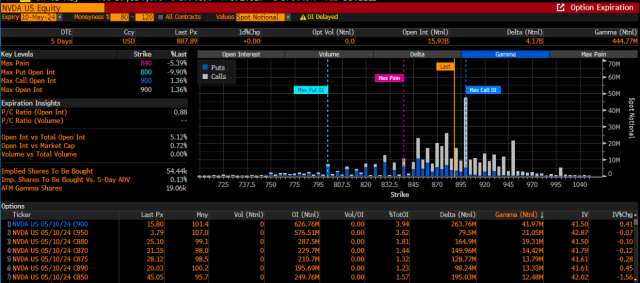
Apple (NASDAQ: AAPL) maintained its gains on Friday, holding above $180 despite closing below its highs. This level is significant given the gamma positioning heading into Friday, with $185 being a key resistance level.

Meanwhile, NVIDIA (NASDAQ: NVDA) faces strong resistance at $900. Breaking this level could open a path to $950, but there's significant gamma buildup between $900 and $950, making the path forward challenging. Strong resistance at $900 is more likely to attract sellers than buyers.