
Gold Price Technical Review
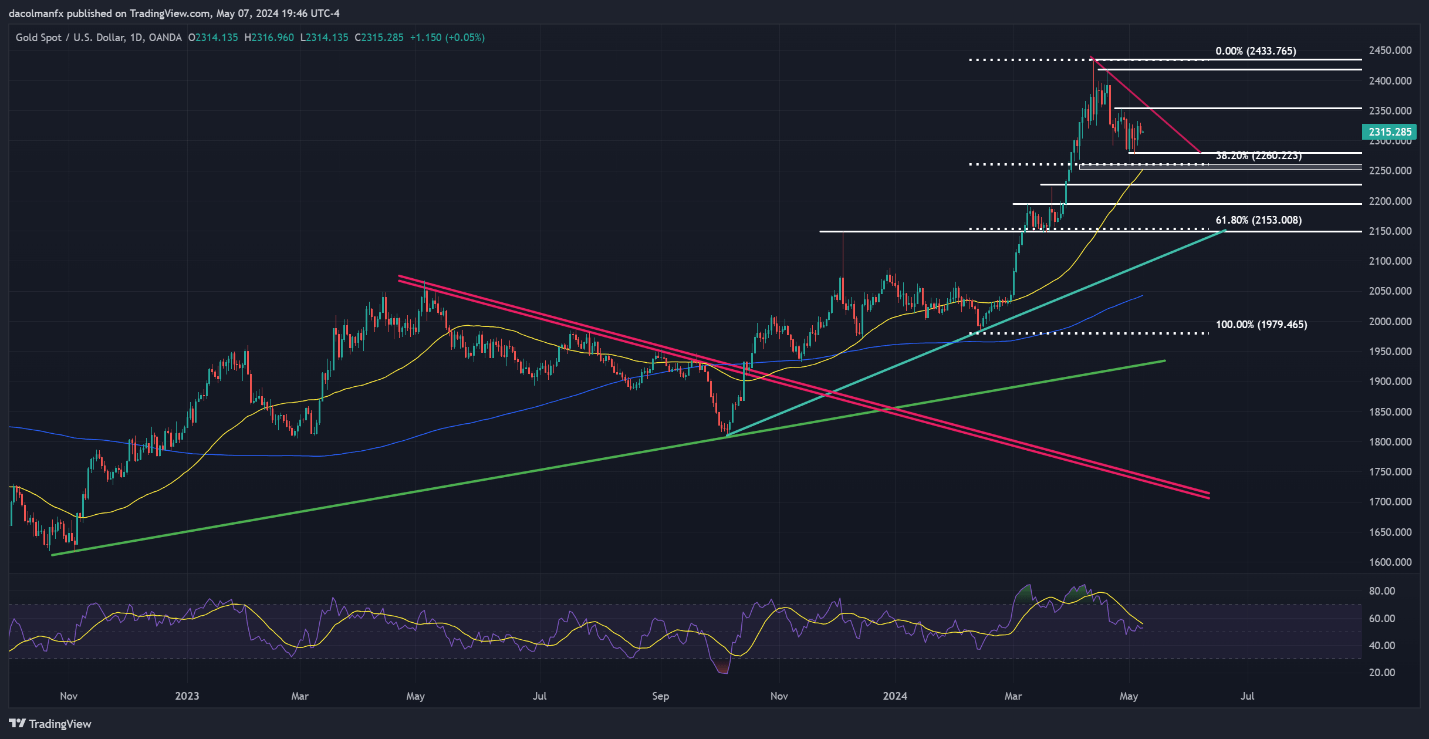
Gold (XAU/USD) experienced a slight retreat on Tuesday after Monday’s robust showing, dipping about 0.4% to close near $2,315. Despite swings to both the upper and lower extremes recently, the metal has largely remained stagnant over the past fortnight, with volatility diminishing—a potential indicator of consolidation as traders await new driving forces.
The stalemate in the market is unlikely to break unless prices breach the resistance at $2,355 or fall through the support at $2,280. Surpassing resistance could shift attention to $2,415 and potentially rekindle interest in reaching new peaks. Conversely, breaking support may prompt a descent towards a crucial Fibonacci level at $2,260, with further focus on $2,225 should declines continue.
EUR/USD Outlook – Technical Analysis
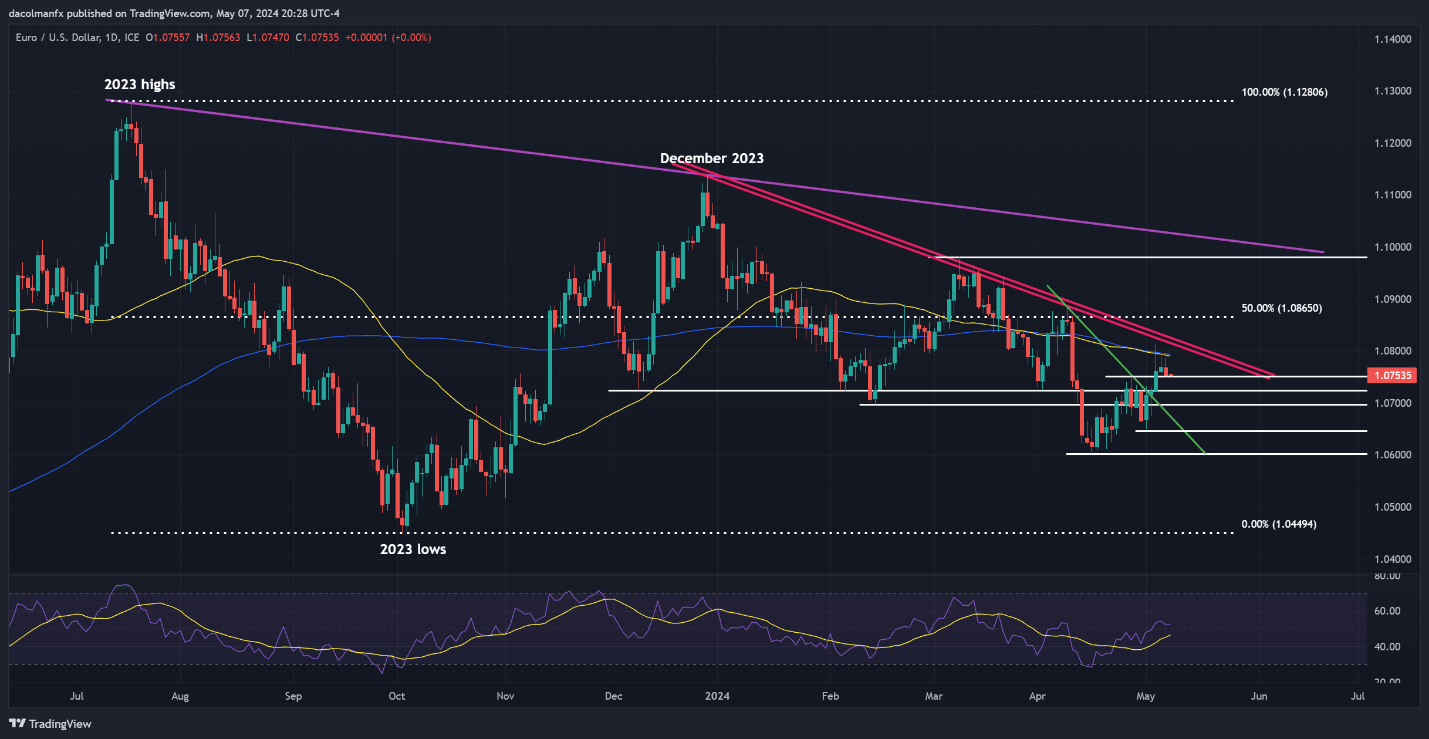
On Tuesday, EUR/USD saw a minor decline following a third unsuccessful effort to surpass its 50-day and 200-day simple moving averages at 1.0790, a robust resistance zone. Prices edged closer to the support at 1.0750, a critical juncture to hold to avoid deeper losses. A breach here could lead to declines towards 1.0725 and potentially 1.0695.
If the EUR/USD starts to rise, the first hurdle will be at 1.0790, followed by a stronger resistance level at 1.0820. This higher resistance line marks a continuing downtrend that started from the highs of December 2023. A continued upward trajectory might empower bulls to target the 50% Fibonacci retracement of the 2023 downturn, situated near 1.0865.
GBP/USD Outlook – Technical Analysis
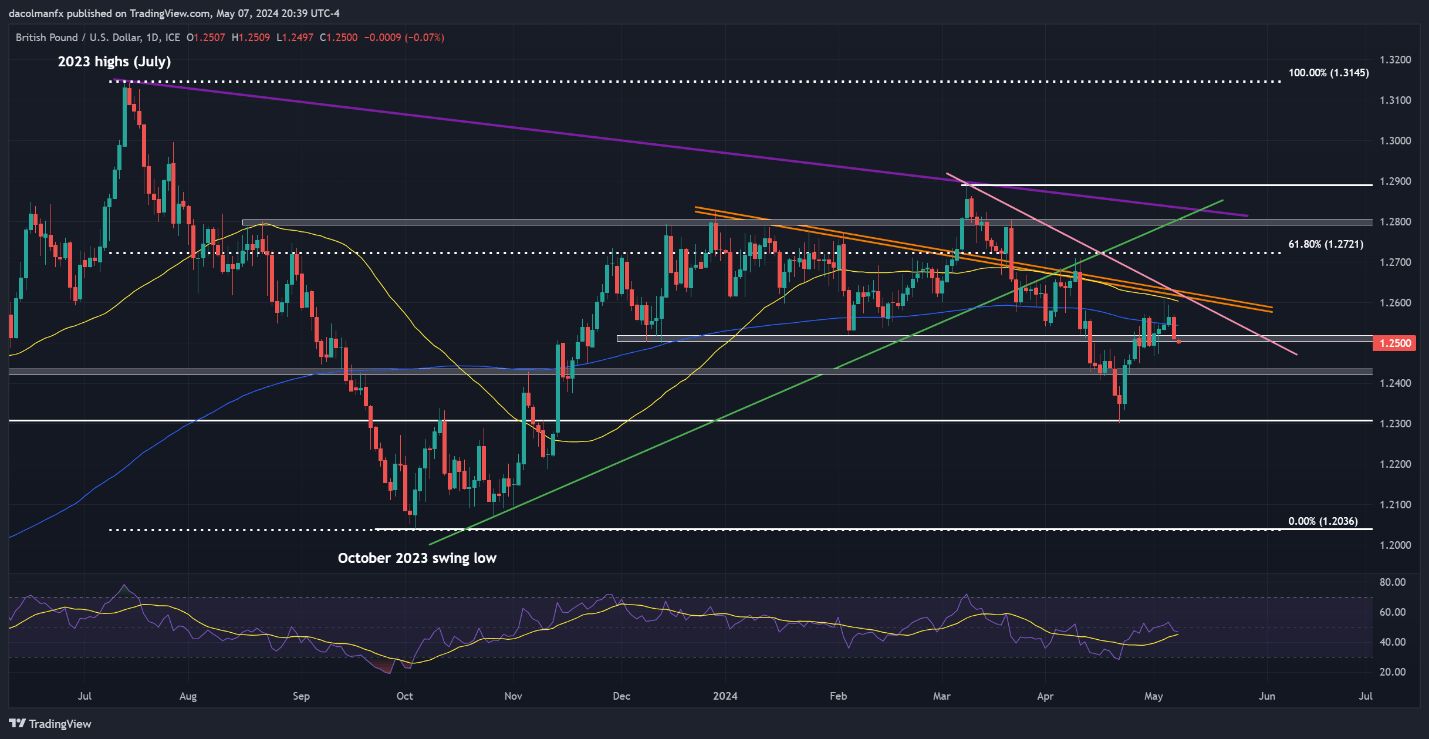
GBP/USD also declined on Tuesday, teetering near the critical 1.2500 level. A firm break below this mark soon could intensify bearish momentum, leading to a possible retest of support near 1.2430. While stability might be found at these levels during a pullback, a further downturn could set the stage for a drop toward the psychological mark of 1.2300.
Conversely, should buyers regain control and push the currency above its 200-day simple moving average, resistance will converge from 1.2600 to 1.2630, marked by the intersection of the 50-day simple moving average and two significant trendlines. Overcoming this barrier could foster market optimism and drive a rally towards 1.2720.