

Want to jump straight to the answer? The best forex broker for traders is Avatrade
The #1 Forex Trading Course is Asia Forex Mentor
Trading is not about trusting your instincts but also about following a strategy that would give you an edge in the market. As a trader, you need the knowledge and experience to read different patterns and trade accordingly. Most veteran investors and traders use the scientific and logical approach to trading, which is mainly based on identifying the key patterns that form in the market. The most popular and well-known pattern is popular and well-known.
The butterfly pattern is a very reliable and powerful reversal pattern that can be found in any timeframe from intraday to monthly charts. The harmonic butterfly pattern is very popular among traders because of its high success rate and easy-to-spot structure. This reversal pattern is used to profit from bullish and bearish market conditions.
The pattern is created when the price action forms a certain shape on the chart that resembles a butterfly. The key to trading this pattern successfully is to identify the right time to enter the market. This pattern is versatile and can be used in different ways to generate profit targets.
To learn the Butterfly Pattern from the expert, we’ve got Ezekiel Chew to share his take on this indicator. Ezekiel Chew is the founder and CEO of Asia Forex Mentor. He is also a popular speaker and has conducted workshops and seminars on technical analysis.
In this guide, we will discuss a harmonic butterfly pattern, how it is useful for traders, bullish and bearish butterfly patterns, and more. So, let's get into the details.
What is Butterfly Pattern
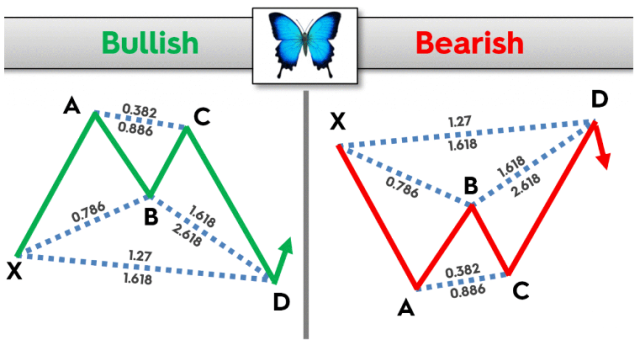
The butterfly pattern is a reversal pattern used for trading both the bullish and bearish market conditions. The key to trading this pattern successfully is to identify the right time to enter the market.
The pattern is created when the price action forms a certain shape on the chart that resembles a butterfly. The pattern is considered complete when the price action reaches the D point. The D point is generally the midpoint of the XA leg.
The harmonic butterfly chart pattern comprises four legs with two peaks and two lows or highs (bullish or bearish), much like the double top and bottom patterns. However, unlike double tops and bottoms, the butterfly pattern begins the trend reversal at the start of the pattern's development. Therefore, it is a more reliable predictor than many other harmonic patterns.
The harmonic butterfly can be applied to any liquid market and time frame chart. The butterfly is part of the harmonic family of patterns, including Gartley, bat, crab, and AB=CD.
Most Used Harmonic Patterns
Many harmonic patterns can be used to trade the markets, but some are more popular than others. The most popular harmonic patterns are as follows:
- The BAT pattern
- The ABCD pattern
- The deep crab patterns
- The crab pattern
- The shark pattern
- The Gartley pattern
- The butterfly pattern
How Useful are Butterfly Patterns
The butterfly pattern is useful for traders because it can be used to trade bullish and bearish market conditions. The key to trading this pattern successfully is to identify the right time to enter the market.
This pattern also indicates the right turnaround in the market. As the patterns are harmonic, the traders and investors can easily estimate the reversal points in the market if they can use FIB ratios.
The forms are designed to symbolize an end of a trend, allowing seasoned traders who have missed out on the opportunity to enter the market during price reversals. Traders prefer butterfly patterns due to their accuracy. Due to the Fibonacci default stop-loss and price targets, they are also easy to trade.
Fibonacci and Butterfly Pattern
Several Fibonacci levels must be recognized for the Butterfly pattern to be correctly recognized. Traders are generally familiar with how important the Fibonacci relationship is for harmonic pattern trading, and it's also true for the butterfly.
Traders must check the structure's price fluctuations corresponding to the distinct Fibonacci levels to confirm a real Butterfly chart pattern. Remember that the B point, or turn-around degree, is critical for the Butterfly pattern and must retrace 78.6% of the XA leg.
The key to trading this pattern successfully is to identify the right Fibonacci ratios. The most important Fibonacci ratios used in this pattern are 0.618, 1.272, and 2.618.
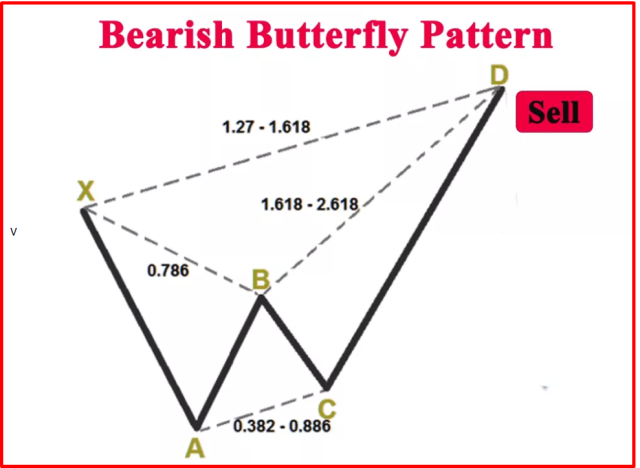
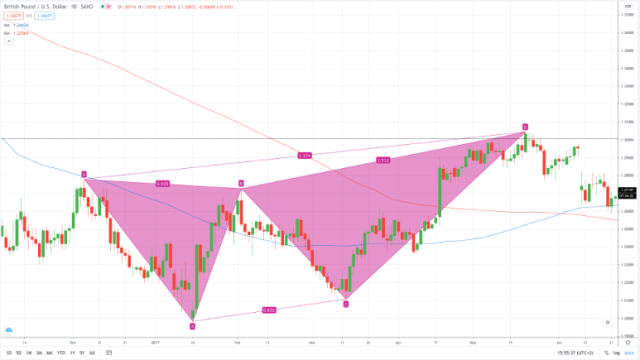
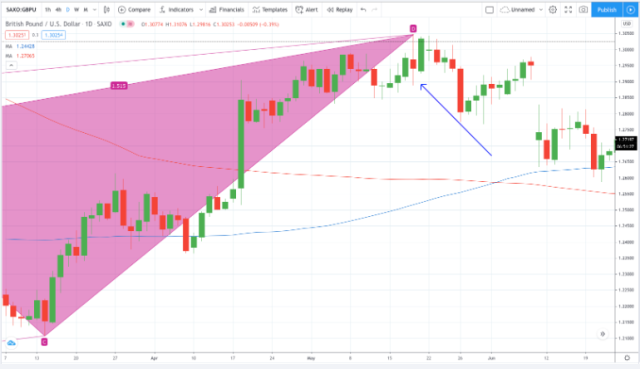
Bearish Butterfly Pattern
The Butterfly Pattern is a volatility indicator that searches for harmonic patterns in price action formation by recognizing evaluated structures on a chart with distinct and sequential Fibonacci ratio changes. These patterns use the Fibonacci parameters of the price movement pattern to indicate reversal points with high chances of profit.
Many investors recognize harmonic patterns as cycles that repeat over time. By finding the optional risk-to-reward ratio, wagering on a reversal, and joining the market based on the probability of identical reproducing swings happening again, traders may make profitable trades with the butterfly pattern.
The Bearish Butterfly Pattern is a four-swing reversal pattern. The butterfly pattern tries to identify the moment when a current price swing will end. Investors who trade reversals rely on the chart's momentum, which they believe will reverse at some point in the future.
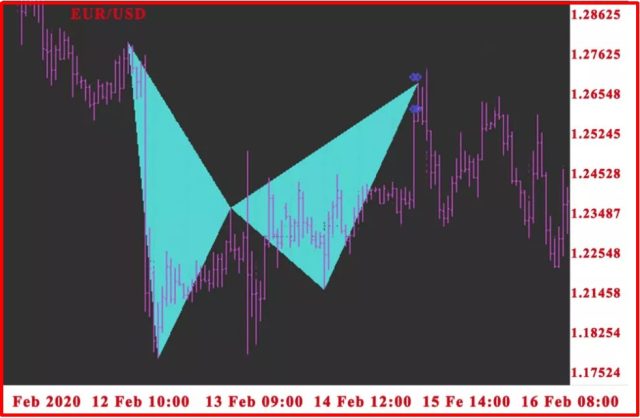
Bearish Butterfly Pattern Example
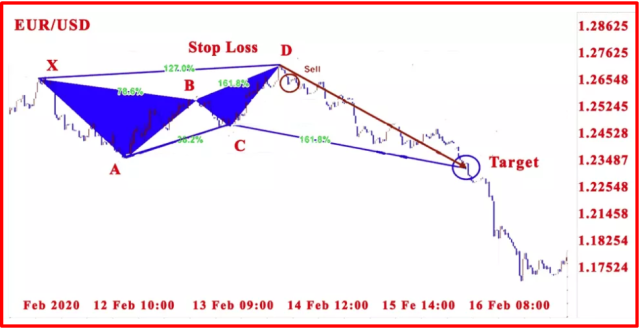
The image of the bearish butterfly pattern resembles the one shown in the above image.
The first swing down is created when the price falls from X to A. Then, the price's decline from A to B repeats roughly 78.6 percent of the X to A drop.
The price swings from B to C, then down again, signaling a change in direction. The next shift is the B to C swing when the price goes back down with a retracement of 38.2% to 88.6% of the A to B upswing's price swing. The C to point D upswing and breakout signal the butterfly pattern's conclusion and acceptance.
The harmonic sequence has an AB=CD price pattern. Still, the C to D upswing occasionally interrupts it, resulting in a 127%, 161.8%, or even a 224 percent price extension pattern of the A to B upswing. As a result, after the overbought move, traders like to sell short at point D, believing it provides a high risk-to-reward ratio because of its proximity to the overbought area.
The Bearish Butterfly Pattern is a reversal chart pattern that indicates a high chance of the price level to sell short at a very overbought reading. After a lengthy rise and extension in price from the mean form's high expectation for a retracement and swing back down.
Bullish Butterfly Pattern
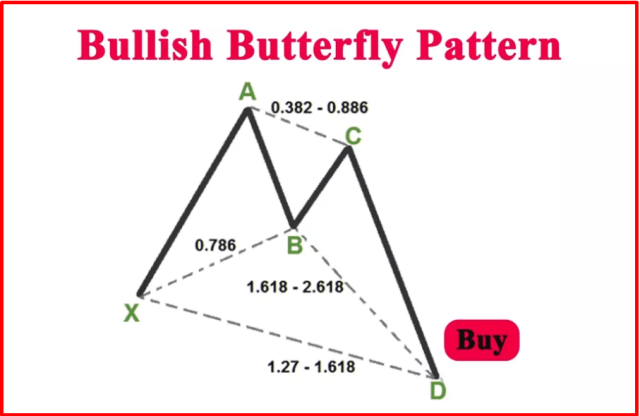
The formation of a Gartley pattern is similar to that of harmonic trading, which resembles an “M” shape on a price chart. On the other hand, it concludes at the intersection of two distinct Fibonacci development levels rather than at the intersection of a Fibonacci retracement and extension as with the Gartley.
The relationship between the two adjacent triangles at point B is critical to this pattern's success. A buy or sell signal occurs as the pattern enters a point D, just as in all geometric patterns.
Bullish Butterfly Pattern Example
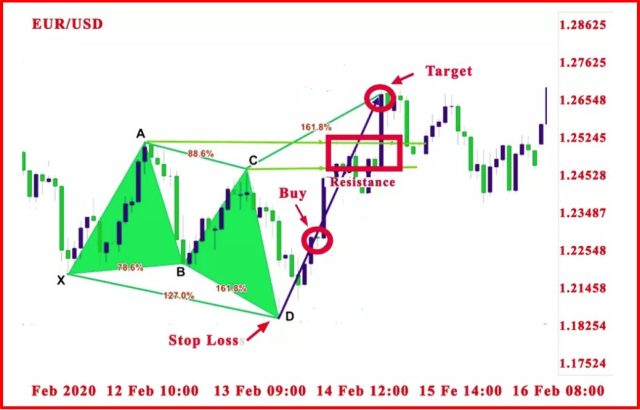
To avoid confusion, note that the lower swing from A to D should be a 127.2 percent or 161.8% extension of XA, with D having to be less than X. When the times of the XAB and BCD triangles are in proportion, additional confirmation may be gained when the extension move (AD) is carried out correctly.
Ideally, the times of these two triangles should be nearly equivalent. Otherwise, check for the BCD triangle to end between 61.8 percent and 161.8 percent of XAB. A move beyond 161.8% destroys the pattern, suggesting that a potentially strong bearish continuation is in progress.
Benefits of the Butterfly Patterns
Below are a few of the noteworthy advantages of the butterfly pattern for forex traders:
- A butterfly pattern is a strong indicator of a trend change. Of course, chart patterns do not guarantee accurate results. But, in most cases, they can lead you in the right direction if implemented correctly, and other forms of technical analysis support the data.
- This pattern offers an endless source of accurate data about the market condition.
- Patterns are simple to identify and comprehend. For beginner traders, butterfly patterns are more employable and recognizable than other chart patterns, making them an appealing first pattern for building a trading strategy.
- The butterfly pattern, according to evidence, is one of the most effective patterns for finding profit possibilities. Compared to other patterns such as the Gartley pattern, veteran brokers are confident in the predictive capability of a butterfly pattern.
- Veteran brokers like the simple design since it is easy to utilize.
Limitations of the Butterfly Patterns
- Forex traders are always looking for the perfect trade, and in their pursuit of this goal, they often come across chart patterns that look great on paper but fail to produce the desired results in the real world. Unfortunately, the butterfly pattern is no different, and it has a few notable limitations:
- Like all technical analysis tools, the butterfly pattern is not perfect, and it will produce false signals from time to time.
- Some traders are upset by the unadorned appearance of the exchange because of its restrictions on Fibonacci retracement levels, butterfly patterns do not appear, and traders looking for butterfly patterns are disappointed by the unfulfilled hope to discover the entire pattern. This implies a lot of wasted effort trying to spot possible setups.
- The harmonic butterfly pattern is based on all-encompassing knowledge of Fibonacci ratios, which is not easily digestible for beginner traders. Without this essential information, it isn't easy to interpret this pattern.
- The butterfly pattern is most effective when combined with other signals and chart patterns to ensure that the setup and outcomes produced by this chart pattern are accurate.
Best Forex Trading Course

Ezekiel Chew is a name that is well-known in the Forex trading industry. He is a highly successful Forex trader and trainer who has taught people how to trade Forex for many years. His Asia Forex Mentor program is one of the most popular and well-respected programs available, and a wealth of experience and success backs it.
The program is designed to teach people everything they need to know about Forex trading, from the basics to the advanced strategies that professional traders use. It is a comprehensive program covering all Forex trading aspects, and a highly experienced and successful trader teaches it.
The program is suitable for both beginner and experienced traders, and it has been designed to give people the best possible chance of success in Forex trading. It is a highly effective program backed by a wealth of experience and success. Signup Now!


Best Forex Brokers
Conclusion: Butterfly Pattern

The butterfly Pattern is one of the most effective patterns for finding profit possibilities. Compared to other patterns such as the Gartley pattern, veteran brokers are confident in the predictive capability of a butterfly pattern.
Whether you are a beginner or an experienced trader, you must first understand the basics and principles of chart patterns as trading tools. They are crucial to revealing a particular trend's reversal or continuation. Not only that, but if you have a more conservative profit target, the harmonic butterfly pattern is the best tool. Furthermore, the butterfly pattern is an excellent indicator as it also pinpoints the potential reversal zones.
Butterfly Pattern FAQs
How accurate is the butterfly pattern?
The butterfly pattern is a complicated harmonic signal structure. However, its signals are accurate.
What is the Fibonacci Butterfly?
Fibonacci Butterfly is a technical indicator that uses Fibonacci ratios to identify potential support and resistance levels in the market. It's one of two well-defined Fibonacci reversal patterns, including the Gartley and the butterfly.


