

Want to jump straight to the answer? The best stock brokers for traders are Tradestation and Tradier
The #1 Stock and Forex Trading Course is Asia Forex Mentor
In the past stock and forex markets were considered to be the art of estimation. Investors and traders who wanted to be successful and earn massive profits had to rely on their market projection skills to anticipate the market trends. However, in recent times, the financial market and its trends have become a science that can be evaluated and analyzed after thoroughly reading patterns, statistics, and charts.
Among these patterns is the W pattern in trading (also known as the double bottom pattern) which is quite prominent and frequently analyzed by traders and financial experts alike to read the market trends. To understand the W pattern comprehensively we've got Ezekiel Chew a prominent financial expert and trainer.
Ezekiel has not only proven himself as the best forex trainer but also a top forex trader who managed to hit the six figures with every trade. Hence, according to him, patterns are generally used to read the market trends and these chart patterns can be very effective if it is assessed accurately.
To understand the importance of the W pattern in trading, this review aims to provide a comprehensive guide discussing all the aspects of the W pattern. Thus after reading this review, traders will know the limitations and benefits of the W pattern. Moreover, readers will be able to position W patterns whenever they appear in the market trends which will help them in making effective financial decisions.
What is W Pattern Trading
Whenever there is a downward trend in any stock, commodity currency, or security, its demand increases. So more people and investors are interested to buy that asset. As a result, the price rapidly jumps up again due to the high demand for the asset. This downward trend and hike in prices form a W pattern or the double bottom pattern which is analyzed by financial experts to constitute investment advice to investors so that they can make effective investment decisions.
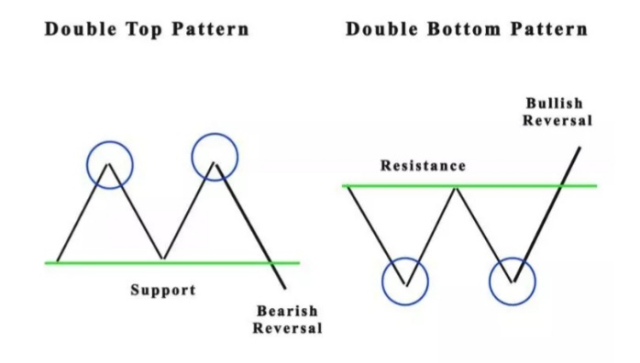
The W chart pattern is read as a bullish turnaround where prices are expected to increase after weeks or months of price decline. The pattern starts emerging when the prices first jump off after the constant horizontal trend line of an asset. This first trend reversal is usually short in duration and does not last long and the price falls again.
The second support level is confirmed by another reversal pattern, however, usually, the price yield is higher than the first trend. The pattern is formed between the two reversal patterns there are two lows under the resistance level. The gap that occurs between two price hikes is the confirmation of a W pattern. At this point, when a W pattern completely emerges during the technical analysis, the financial advisors usually advise investors to enter long in the trades.
Sometimes traders and investors do not read the double bottom pattern accurately and start investing early in the pattern. This might turn out as an opportunity for some as buying sooner also have chances of reward, however, to play safe it is important to wait for the middle gap to confirm the W pattern and invest accordingly to earn maximum profits. Thus, even though the formation of the pattern might take weeks or even months however this patience is often rewarded.
Trading with W Pattern Trading
If an investor or trader is willing to follow the W or double bottom pattern, then a proper technical analysis is required. Trading with the W pattern can result in a balanced investment portfolio that can provide massive capital-gaining opportunities. However, to utilize this chart pattern competence on the part of the analyzer is of utmost importance.
Any market trend at the initial stage is likely to deceive the investor as a possible chart pattern including the double bottom pattern. For this reason, it is crucial to wait patiently and look for all the signs of a chart pattern before making any investment decisions.
The first clue of a double bottom pattern is that it always starts with a downward market trend. Then a single round bottom becomes visible usually towards the end of a bearish reversal pattern. Next, this same sequence is repeated when traders start to capitalize where it last falls to a support level and this forms a double bottom pattern. Hence, the pattern starts with a bearish trend however it ends signaling a bullish reversal pattern for the investors.
The correct identification of double bottom formation can serve as a confirmed indication of a bearish market trend and that the field is open for long positions. Therefore, W chart patterns among financial tools can become a great chance for investors to seize the right set of market positions and make investment decisions accordingly.
Limitations of W chart Pattern

The W patterns or double bottom patterns are one of the tools among many other that helps investors and traders to read the market trends. Consequently, through such information investors are in a better position to anticipate that future trends and make the most out of their investment portfolios.
However, even when generating significant profits is highly probable after following the double bottom patterns, there is always a chance of misinterpretation and inaccuracy on the part of the analyzer. Hence, one must be careful while making any reckless decisions as incorrect identification of the pattern can lead to significant risk.
The double bottom pattern always results after a strong downtrend. However, this part alone cannot be assumed as the confirmation of a W pattern. For this reason, an investor has to look for all the signs and forbearingly wait for the most crucial support level and middle resistance level to verify the W pattern. Any hasty assumptions can result in high risk and can lead to an early withdrawal from a position.
Locating a Potential Double Bottom Pattern

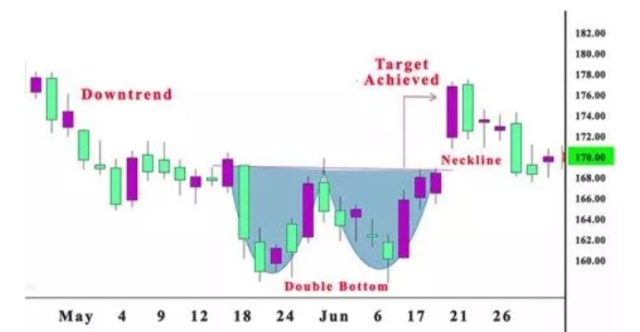
The first sign of locating a double bottom pattern is the two back-to-back bottoms with almost equalizing lower prices. The first bottom is right after the bearish trend reversals. Next, the prices bounce back and locate a resistance level which is also known as the neckline.
At the second bottom, the prices decline again equaling the prices of the first bottom. The second bottom also follows the same direction as the first phase and takes support on the neckline as before. This forms a pattern of two lows which are mostly identical and known as the two bottoms.
Even when this trend of two lows is a significant indication of the W pattern, however, other technical indicators should be considered while coming to any conclusions. For instance, the interval of the neckline represents the resistance level of the investors. This resistance also signifies that the market prices will be going towards an upward trend.
It is also very important to be mindful of the fact that the W pattern might not be as clearly visible in the technical analysis as it is imagined by the investor. The exact shape of the pattern may not be a perfect W and there can be variations to some degrees. For this reason, it is essential to look for not an ideal image but focus on the indicators such as the bearish trend, two low bottoms, and a break at the neckline.
Swing Traders Using the W pattern
Swing traders are those individuals who try to do profitable trading transactions in a very short span of time which is between 24 hours or less than a month. The reason they are called swing traders is that they try to take advantage of the fluctuation or swing movements of the market trends.
Swing trading also requires the support of technical analysis so that the traders can make quick decisions along with the flow of the market price action. For this reason, swing traders take a quantitative approach following any chart pattern like the head and shoulders pattern or the support and resistance W patterns.
In the W pattern, there is a support and resistance level which signifies that the buyers are in a stronger position than the sellers. Consequently, in the final phase of the W pattern, the prices bounce back again. This situation is the best opportunity for a swing trader to enter the trader when the prices move away from the support level.
Moreover, swing traders can also choose to enter the market when there is a resistance phase in the pattern. This happens when the market resists the buying pressure and again moves towards the second low. In this scenario, a swing trader can sell the assets and place a stop loss above the resistance line.
Best Stock and Forex Trading Course

Asia Forex Mentor offers the best forex trading education in Asia. The course is set up so that you can earn money while learning. You'll be able to trade forex profitably with a skilled trader's help. In Singapore and other sites worldwide, tens of thousands of people from the United States, the United Kingdom, and other Asian countries have been taught.
Ezekiel Chew's teaching method is founded on the principle of return on investment, which states that if you invest $1, you will gain $3. It's not about zany strategies or elaborate procedures. Professional traders and financial organizations use his authorized system. He is the driving force behind the growth of various companies, including DBP, the Philippines' second-largest state-owned corporation.
Due to his strategy's effectiveness, many full-time traders have joined the program with little to no prior trading experience and emerged successful.


Best Stock Brokers


Conclusion: W Pattern Trading

A W pattern also commonly known as the double bottom is a financial markets chart patterns that are used in most of the standard technical analyses of market trends. The main function of this chart pattern is to identify and indicate the change and movement reversals from the initial stage of the price action. Hence, the downward and upward trends following the support and resistance level of the investors can be evaluated through the double bottom.
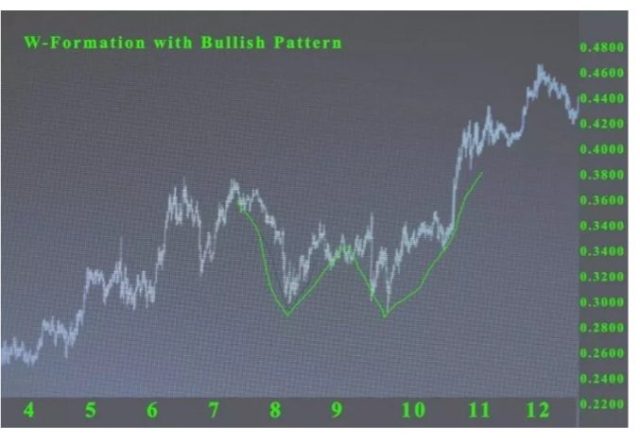
The W pattern reflects price reversals not only on line charts but also on bar charts and most commonly on candlestick charts. However, all these different charts are used to show the price decline and a price comeback and then again another price low same as the first one and finally the last rebound. The most distinctive feature of this pattern is that it not only beats the supply not once but twice with the high demand of the buyers and also within a very short period. Hence, these swinging price movements create a W pattern on the charts.
There are a few key features of this pattern that can be marked as the identity of double bottom chart patterns. The first component is that the W pattern always begins with a bearish or downward trend and leads to a short reversal of an upward trend. The second element is the two similar or equal lows or bottoms which are located at the support level. Finally, the breakout candle or neckline is the last confirmation of a successful double bottom.
The advantage of using the double bottom chart pattern for profitable trading transactions is that it highlights the overall picture of the financial market in the long run. It clearly shows where the price is moving so that traders can confidently trade with ease. Hence. the W chart patterns help the investors to make informed financial decisions and make investments accordingly.
Conversely, the drawback of the W chart patterns is that it takes a considerable amount of time to take its final shape. Financial experts agree that it at least takes as long as three months for the pattern to signal the highest probability of success. The ideal way to use these charts is to give them a longer timeframe and patiently wait for the pattern to completely appear. Thus, any quick moves by the investors to conclude the W chart patterns can lead to disastrous results.
W Pattern Trading FAQs
Is W pattern bullish?
Yes, a W or double bottom pattern is a bullish reversal pattern. It is bullish because it starts from a downward price trend. The pattern shows the price movements and reversals to indicate the overall picture of the market trends in the long run. This pattern describes the upward and downward trends of the market and shows which position is best suitable for different traders.
It is also a notable point that the W pattern starts with a bullish trend however after two lows and a bounce back of the prices it takes a bearish approach towards the end.
What is the W pattern in trading?
A W pattern or a double bottom pattern is a chart that is used in technical analysis of the financial market trends. This pattern is used by financial experts and investors as a standard pattern to figure out the price fluctuations and the overall market trends. This pattern takes time to form however when the complete pattern emerges it affirms the price position of the market and also helps in ascertaining future predictions.
This pattern usually starts with a downward market trend followed by two bottoms and a balance peak in the middle. The final shape of this pattern shows ups when the price hikes again and the reversals lead to a bearish position. The most distinctive element of this pattern among others is that it has two price lows back to back which are equivalent to each other and is followed one after another in quite a short period of time.


