
Want to jump straight to the answer? The best forex broker for traders is Avatrade
The #1 Forex Trading Course is Asia Forex Mentor
Forex traders always look for chart patterns to identify the best entry, stop loss, and take profit points. The shooting star candlestick pattern is one of the chart patterns often analyzed by forex traders to identify the market trends when trading.
A shooting star candlestick pattern is a unique trading chart pattern that forms a bearish candlestick pattern formation at the end of a bullish trend and indicates a bearish reversal. The shooting star candlestick pattern is a popular bearish reversal candlestick pattern that frequently takes place in technical analysis. However, it is easy to identify.
To simplify this technical analysis in this article, we have an expert forex mentor, Ezekiel Chew, to enlighten us on the shooting star candlestick pattern. Scroll down the paragraphs below to further understand the concept of shooting star candlestick patterns and how to identify and apply them to your forex trading.
What is the Shooting Star Candlestick Pattern?
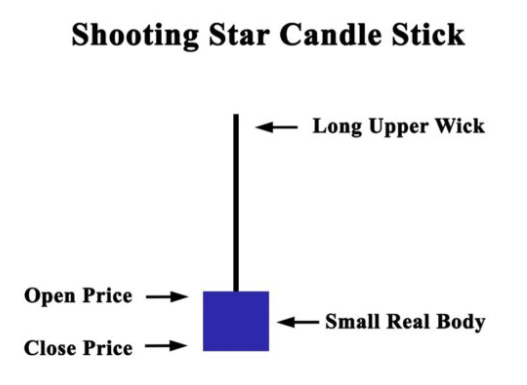
A shooting star candlestick pattern is a trading chart pattern that occurs at the end of an uptrend and indicates a potential uptrend followed by a bearish reversal candlestick pattern. This bearish reversal candlestick pattern comprises a long upper shadow, a little or lower shadow, and a small candle body.
The long upper shadow indicates that although the bullish trend had tried to push the market prices higher, the bearish candle was able to control and force buyers back at the end of the trading period. The shooting star occurs in a market situation where buyers can no longer make price advances and face strong horizontal resistance with the same buying pressure.
The pattern is a bearish pattern that is part of the hammer pattern group and formed after some up move in the market. Its appearance suggests that there could be a top horizontal resistance level.
The shooting star candle pattern is such that the shooting star candle has a long upper shadow, and the shooting star has a very small body, indicating that the trading period between the open price and the close price is very narrow.
The shooting star candle looks exactly like the bullish hammer pattern and the inverted hammer candlestick pattern. Still, the difference is that the shooting star occurs at the end of a bullish trend and a top bearish candlestick reversal pattern. The other two patterns are single candlestick patterns that occur at the end of a downtrend.
Identifying the Pattern

Just like the other forms of technical analysis of candlestick patterns, there is a dire need to perfectly understand the shooting star patterns to identify and apply them as part of the forex planning strategies.
Fortunately, identifying the shooting star candlestick pattern is a very easy and straightforward process—all you need to do is look for candlestick patterns that have long upper shadows, little or lower shadows, and an incredibly small body at the lower end of the candle pattern.
The long upper shadow validates the shooting star candle pattern and implies that bullish trends dominate the trading market. The upper shadow is at least twice or even thrice the small body of the candle pattern. Together with the shooting star's small body, it can be interpreted as a shooting star bearish candlestick pattern.
The long upper shadow indicates that the trading market is attempting to locate the next horizontal resistance level. This leads to a price advance as a result of the bullish version. This action encounters horizontal resistance where the bears enter the market, and this price action causes a change in the bull's positions.
When the deference depicted in the shooting star candle patterns between the open price and the close price is on the higher side, it simply implies that the bears have dominated the market; this candlestick pattern is the bearish candlestick pattern in technical analysis.
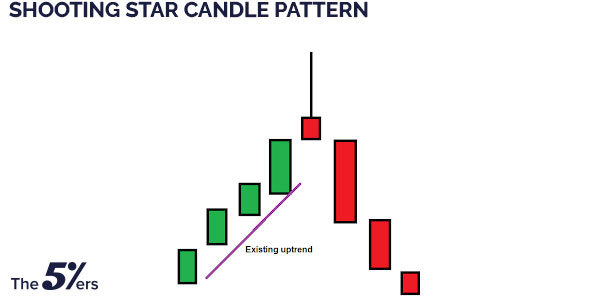
The Shooting Star Candlestick Pattern Explained
Forex traders who are beginners in trading may not be familiar with candlestick patterns. However, this article has you covered.
Considering the trading chart below, it will be easy to explain the shooting star candlestick pattern and how it works. The chart below is a GBP/USD 30-min chart, and it is observed that the shooting star candle pattern occurs after an uptrend and indicates a bearish reversal candlestick pattern of the current trend.
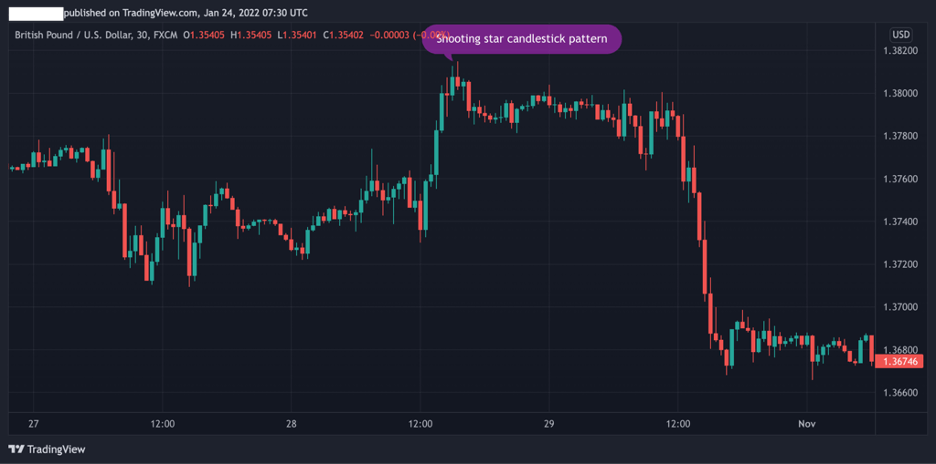
Still discussing the above trading chart, it will be used to explain the shooting star candlestick pattern to easily identify and trade the shooting star candle pattern.
- The first step is identifying the bullish version in the trading chart
- The next thing is to look for candlestick patterns at the extreme top of the uptrend bearing with a long upper shadow, a lower shadow, and a small body
Generally, the shooting star candlestick pattern appears in an uptrend, and when this occurs, there is a price advance by the bullish version or the buyers. But it gets to a point where the price moves stop increasing and fall below the open price. At this point, the shooting star candle portrays a long upper shadow and a lower shadow with the closing price lower than the opening price.
The length of the upper shadow, which is always three times the lower shadow, confirms the bearish candlestick pattern. The shooting star candlestick pattern is observed at the top of the trend and signals the shooting star reversal pattern of the trend. Forex traders take positions immediately when they notice the bearish reversal pattern.
Advantages of using Shooting Star Candlestick Pattern
The shooting star pattern is an excellent forex trading tool and has many advantages for forex traders and investors to benefit from. Some of its advantages include;
- The simplicity of identifying the star candlestick pattern and trading the shooting star is one major advantage. The long upper shadow and the lower shadow alongside the small body in the candlestick patterns are very easy to identify compared to other candlestick patterns.
- The shooting star candlestick is a reliable technical analysis indicator in forex trading. Technical signals can sometimes give false data, but for shooting stars, it is very reliable; as the star candlestick pattern approaches the horizontal resistance level, it confirms the bearish candlestick pattern and otherwise a bearish reversal.
- The stop loss placement is quite easy to spot on the trading chart; placing the stop loss above the shooting star candlestick is advisable.
- The star candlestick patterns work well with other momentum indicators like the Moving Average Convergence Divergence (MACD) and Relative Strength Index (RSI).
Shooting Star vs. Hanging Man
It is not uncommon to find some people confuse shooting stars with hanging men, and as such, they mistake shooting stars for hanging men on a trading chart. However, are there any differences between the two? Find out below.
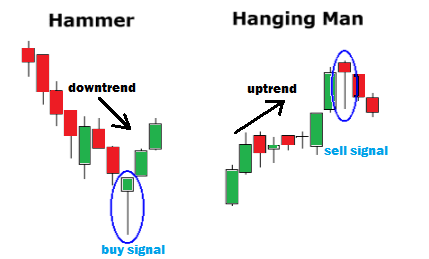
- The shooting star is a bearish candlestick pattern that forms at the end of an uptrend, while a hanging man is the bearish shooting star reversal pattern. Hanging man is the shooting star reversal pattern, just like an inverted hammer is the reversal pattern of the hammer pattern.
- A shooting star is a hanging man turned upside down, and for a hanging man, unlike a shooting star, the small body is near the top of the star candlestick.
- The Shooting star has a long upper shadow with a lower shadow while a hanging man has a long lower shadow at least thrice the small body and a little or no upper shadow.
Shooting Star vs. Inverted Hammer Pattern
Is the shooting star different from the inverted hammer candlestick since they're both other forms of reversal candlestick patterns? They're quite different, even though they both indicate a bearish reversal.
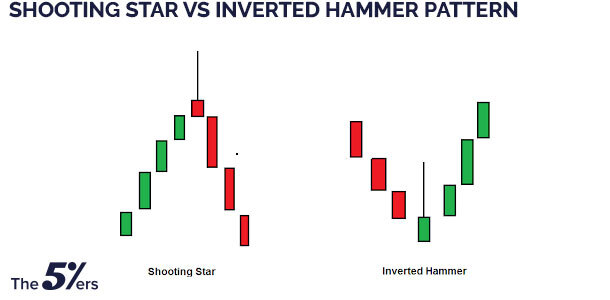
- An inverted hammer candlestick is another form of candlestick pattern that appears after a downward price action moves to the bottom. This implies that an inverted hammer candlestick is a bullish reversal pattern and occurs in a downtrend, unlike a shooting star, which is a bearish reversal pattern but displays in an uptrend.
- The shooting star formation is created because of price advantages, as it implies that the price action has a higher tendency to point lower. In contrast, an inverted hammer candlestick is created because of price reduction, which implies that the price action tends to point higher.
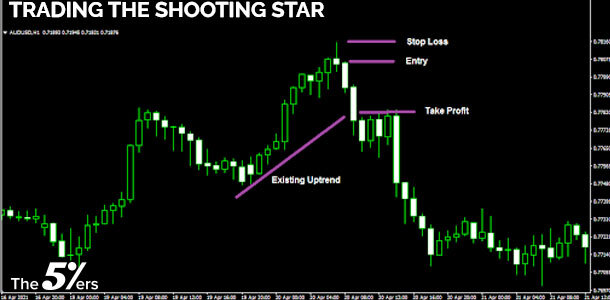
How to Trade Shooting Star Candle
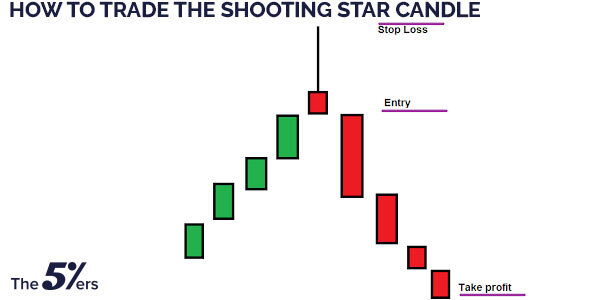
#1. The Entry Point
For a shooting star pattern to occur, there must be three bull candles in the uptrend, and the trading market must be under the control of the bullish trend. Forex traders might need time for a bullish trend reversal whenever horizontal resistance is identified.
Subsequently, the reversal begins, and the following candlesticks might have swings as a struggle might break out between the bears and the bulls to favor a shooting star formation.
At this point, brokers should expect a price action, and when the price moves under the shooting star formation, the trading market will remain bearish in the following candlesticks.
#2. The Stop Loss
The best time for stop loss is the upper shadow of the shooting star candlestick. The long upper shadow of the star candlestick pattern is the reducing point of the price action, and it is also the point where the price is reversed.
The trading market has uncovered the horizontal resistance at this point, but if the price exceeds this level, the market will remove the resistance. At this point, the pattern is not valid, and control returns to the bullish trends. Stop loss is usually placed above the shooting star candle by Forex traders.
#3. Take Profit
The pattern provides for the measurement of the take profit; the take profit is usually three times the entire length of the shooting star candle. Forex traders calculate the length of the shooting star pattern candle from the low to the highest price, and the pattern develops quickly when the bears control the market.
Best Forex Trading Course

There is no doubt all these things may seem a bit technical to follow. In fact, the price makes so many wild swings each day that it can be very hard to measure buying pressure or selling signals. Also, learning all the technical analysis you need for forex takes more than just a day. Instead of relying on the odd article here and there, you may want to get a full detailed course to take you through all these situations.
Here is where the idea of the Asia Forex Mentor by Ezekiel Chew comes in. The course is a robust introductory guide that will give you the knowledge you need to trade forex. It's a beginner-friendly guide as well that works for folks who want to trade forex and any other financial asset.
The Asia Forex Mentor will not just teach you how to predict price shifts, daily volume, and these other technical indicators. It will also teach you how to manage capital and explore some of the most advanced risk control measures in the world. After all, as long as you are managing your capital correctly, identifying overbought and oversold pairs will be the easier part.
Also, if you are an advanced trader looking to learn some of the tricks used by leading banks, this course is also ideal. As a matter of fact, The Asia Forex Mentor is developed by someone who has taught some of the leading investment bankers how to trade forex. You will be able to identify a losing trade, gauge price movement under immense trading pressure, and maintain a level head even when the markets are volatile.


Best Forex Brokers
Conclusion: Shooting Star Candlestick Patterns
The shooting star candlestick appears as a bearish candlestick pattern at the end of a bullish uptrend and signals a bearish reversal pattern. The shooting star is a frequently occurring candlestick pattern in technical analysis but is very easy to identify and is a reliable candlestick pattern.
The shooting star pattern has a long upper shadow, little or lower shadow, and a small body on the star candlestick pattern. The color of the shooting star is not important as long as you can differentiate between a bearish reversal pattern and a bullish reversal pattern.
The shooting star pattern is a common and essential candlestick pattern that every forex trader must know how to use either as a beginner or veteran. The shooting star pattern offers entry, stop loss, and take profit levels.
Shooting Star Candlestick Pattern FAQs
Is shooting star bullish?
No, a shooting star is a bearish candlestick pattern that occurs at the end of an uptrend and signals a bearish reversal. The shooting star candlestick has a long upper shadow, a lower shadow, and a small body. Shooting stars can never be bullish but only bearish.
Can a shooting star candle be green?
There is no specific or fixed color for the shooting star pattern; the shooting star candlestick can have any color, black, white, red, or green, depending on the trading chart setting.
On the other hand, according to the traditional trading chart setting of red and green candles for bullish and bearish patterns, a shooting star cannot be green except for red.


