
One amazing approach to analyzing markets is relying on a solid understanding of how specific indicators work. So the analysis relies on the indicators and not assumptions, hope, or wishes.
In light of fostering the above spirit among traders, we bring you exclusive content to help you base your induction on, plus we give you more clarity about key indicator readings.
This post will dedicate efforts to the TRIN indicator. The expert on board to guide us with insights here is Ezekiel Chew, from the Asia Forex Mentor. In other circles, Ezekiel trains and mentors traders as a part of giving back to society.
Also, you'll find Ezekiel in reputable panels discussing the financial market. And traders follow closely on his insights – he has over 20 years of trading experience.
Other than getting you to know what the TRIN indicator is, we’ll cover how its calculation is done. There’s a key section dedicating efforts to the understanding and use of the indicator – these two are very key.
Towards the end, we’ll cover some practical limitations of the TRIN indicator to help you anticipate its challenges with it. Finally, there’s a conclusion, which also ties up anticipated questions – under the FAQs section.
What is TRIN Indicator?
The term TRIN derives from two names, so it’s a short form of Trading Index. TRIN shows up as a form of an oscillator, and it primarily gives a measure of the market volatility for an underlying market.
For market security, the currency pair of CFD, TRIN makes a comparison between two metrics: advancing (ad volume ratio or ad ratio) and declining volume of markets vis a vis the advancing volume.
In another simple explanation, the TRIN indicator is a short-term trading index
that helps visualize the zones of market supply and demand for a stock market.
By extension, the zones of supply and demand bring about the scenarios of whether a stock market is overbought or oversold. And building on the insights, traders predict market breadth in light of advancing and declining prices in a stock market.
If we now bring in the aspects of volatility and its effects on prices, traders are able to spot the opportunities within which they can thrive. Therefore, TRIN highlights market breadth in technical analysis, and it’s most helpful for scalpers and day traders.
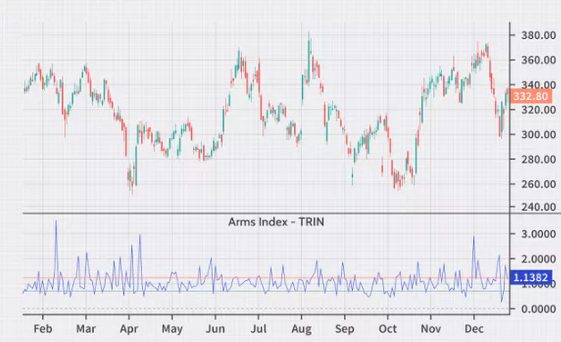
Arms Index Trin is a breadth indicator by Richard Arms in 1987. So, it’s common for analysts to refer to it as the Arms Index – after it's the developer.
Back in the time, Richard made efforts to analyze two broad relationships. One is the rising and falling of prices. And second is the increase or decrease in volumes sold for a specific asset in the market. Richard found very insightful connections between the two and turned them into the breadth indicator for reliable analysis of the advance-decline volume ratio during trades.
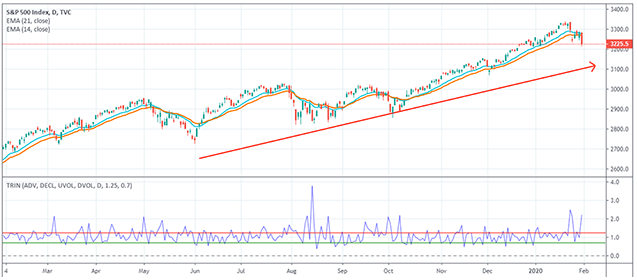
TRIN as an indicator is very helpful for trading anything on the charts: Forex pairs, cryptocurrencies, and futures. However, its use is most widespread across stock markets like the NASDAQ and NYSE. And TRIN goes ahead to super-perform usage of other indicators like the TRICK when we narrow down to the trading of stocks.
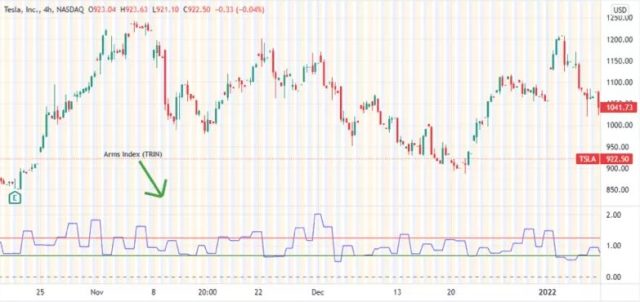
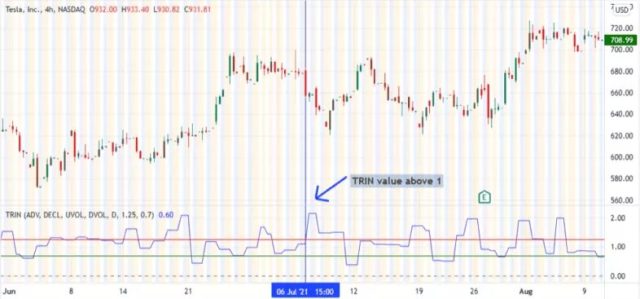
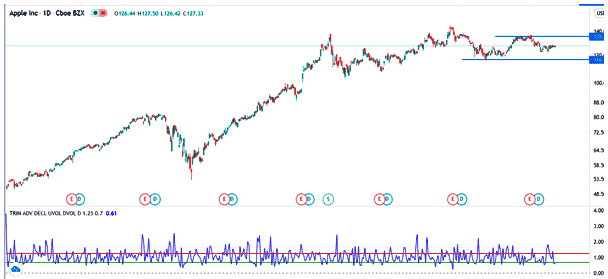
Above is a screenshot of the TRIN indicators in action for the Tesla Stocks chart. It’s picked from the NASDAQ exchange via the Trading View platform.
How to Calculate Arms Index or TRIN Indicator?
It’s important for traders and analysts to understand that they must not calculate the TRIN index manually. The TRIN is calculated by trading platforms with add-ons. However, the understanding of manual calculation helps greatly with the inferences drawn from the ones auto-calculations by platforms.
To help traders understand the procedures of manual calculations with data, we go over the steps below:
- Calculating the AD ratio – being a division of the advancing by the declining stocks. And this works with the intervals a trader or analyst sets to analyze.
- Calculating the AD volume – being a division of the totals of the advancing volumes and the declining volumes.
- Calculating the AD volume by dividing the AD Ratio by AD Volume (as obtained in steps 1 and two above).
- Plotting the results on a graph against time intervals.
- The results from 1 to 3 above are done repeatedly and with respect to the timeframe of analysis.
- Lastly, it's the connecting of the data points obtained in line with step 5 -above. The resultant line on the graph shows the arms index or the TRIN indicator.
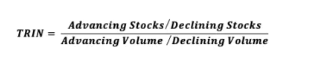
Below is an image of the formula for the arms index TRIN.
Understanding TRIN or arms index Indicator
Good knowledge of the indicators forms a good basis for market evaluation. And it best suits an asset one is targeting. We’ll go over the key readings and share what experts believe they infer from the markets in line with future price movements.
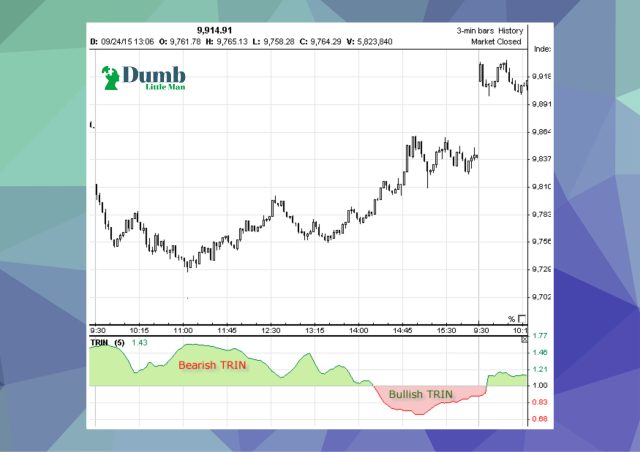
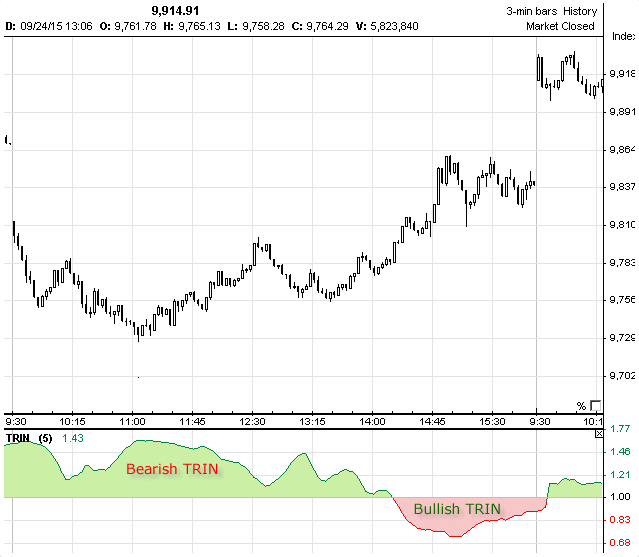
First, a TRIN value reading of one shows that the asset in the underlying market is at balance. By balance, we refer to the ratios of the advance/decline stocks equaling the ratio of the advance/decline volumes. For example, this happens when the market is at equilibrium – or in other words, it's neither oversold nor overbought.
Very Important Point: TRIN or arms index indicators may show readings that seem opposite in interpretation to most other indicators in the form of oscillators.
Therefore, in line with the above example, most readings of the arms index indicator appear to be inverses of what most would.
So, very high values of TRIN score lead to show markets have many sellers. And the other reverse holds true; low values indicate that the market is under the control of buyers.
In finer details, arms index readings or scores below the value one indicate a very strong bullish market.
And the same point towards strong advancing issues being more powerful than the declining issues – hence the result in the price rally. In addition, some analysts believe that if the long long-term index readings fall below one, it points toward a market sentiment that's bullish.
When the arms index readings are below 0.5 constantly, the market is considered overbought and hence could lead to a bearish reversal.
Conversely, TRIN scores higher than one imply a strong bearish sentiment may reign in the markets – since declining issues are greater than advancing ones. Of course, long-term index readings higher than 1 is a pointer toward bearish market sentiments.
Arms Index Trin – Oversold or Overbought markets
Consistent TRIN readings higher than the score of 3.00 points to oversold zones. Therefore, traders should brace for highly likely bullish reversals.
Helpful Note: Under some rare occurrences, TRIN values navigate within the extremes of; the 0.5 and 3.00 values in that order.
During the rare occurrence, it’s upon a trader or analyst to analyze and see where the extremes lead in light of the timeframes they trade to signal if the underlying markets are either oversold or overbought.
How to use the Arms index or TRIN Indicator
TRIN can help traders with signals via three sets of approaches. It’s important to mention here that TRIN is a Leading indicator. Therefore, it can reliably generate signals for buying, selling, and reversals.
First, TRIN or Arms Index readings falling below value 1 serve as buying signals. This is because advancing volumes are greater than the advancing stocks, while declining volume is greater than declining stocks.
Second, an arms index greater than 1 serves as a selling signal.
Lastly, extreme readings or scores, i.e., above 3.00 plus below 0.5, are reversal signals. Above 3, markets are in oversold conditions – and a bullish reversal may reign next. Readings below 0.5 indicate overbought markets, so bearish reversals will likely reign next.
TRIN Indicator limitations
TRIN performs well with identifying buy and sell opportunities, plus confirming market trends.
One drawback of TRIN is the inability to capture market volatility clearly.
Volatility is a key ingredient to successful trades. To minimize the limitation, market experts work with TRIN with 10-day moving averages. However, the TRIN indicator can mislead in case advancing volumes are lower than average.
Sometimes, TRIN may give contrary signals. The best way for most traders to filter false signals is by combining the TRIN indicator with other complimenting indicators to realize better results.
Best Forex Trading Course

Ezekiel Chew is a highly reputable forex trader, trainer, and mentor. He is the founder of Asia Forex Mentor, where he provides training and education to people who want to learn how to trade forex. He is also a highly sought-after speaker and has been featured in many major news outlets.
He has over two decades of experience trading forex and is one of the few traders who are consistently profitable year after year. In addition to his outstanding trading results, Ezekiel is well-known for his ability to teach others how to trade. As a result, his students highly regard his courses, and many of them have become highly successful traders.
Ezekiel's courses cover everything from the basics of forex trading to advanced trading strategies and risk management. He also offers one-on-one coaching for students who want to take their trading to the next level. If you're serious about learning to trade forex, opt for the AFM PROPRIETARY ONE CORE PROGRAM to kickstart your trading career.


Best Forex Broker
Conclusion: Arms Index TRIN Indicator
TRIN arms index indicator brings together the Up volume divided by the Down volume (AD volume) against the volume ratio of Advancing/Declining issues.
When the arms index value falls below one, it points toward an oversold market or a bullish sentiment. Conversely, readings above one are a pointer to an overbought market gathering bearish bias.
It’s also important to note that the extreme arms index seeks to point toward market reversals in either way – bullish or bearish. And this outcome builds on the reliability of TRIN at pointing out market conditions with respect to either overbought or oversold.
TRIN falls among leading indicators and is, therefore, very popular with day traders – including those on lower time frames like the scalpers.
Lastly, we encourage traders to read every point we share on this post. While very helpful, they should not construe it for financial, legal, or investment advice.
TRIN Indicator Trading FAQs
Is TRIN or Trading Index Indicator profitable?
TRIN indicator is not profitable on its own. Traders should combine it with other complimenting indicators to filter out false signals for overbought or oversold markets.
What does TRIN Indicate?
TRIN indicates volatility in the markets, plus conditions of oversold or overbought markets. Analysts should accustom themselves to the readings and bring onboard indicators to help come up with a reliable trading strategy.

