


Recent Developments
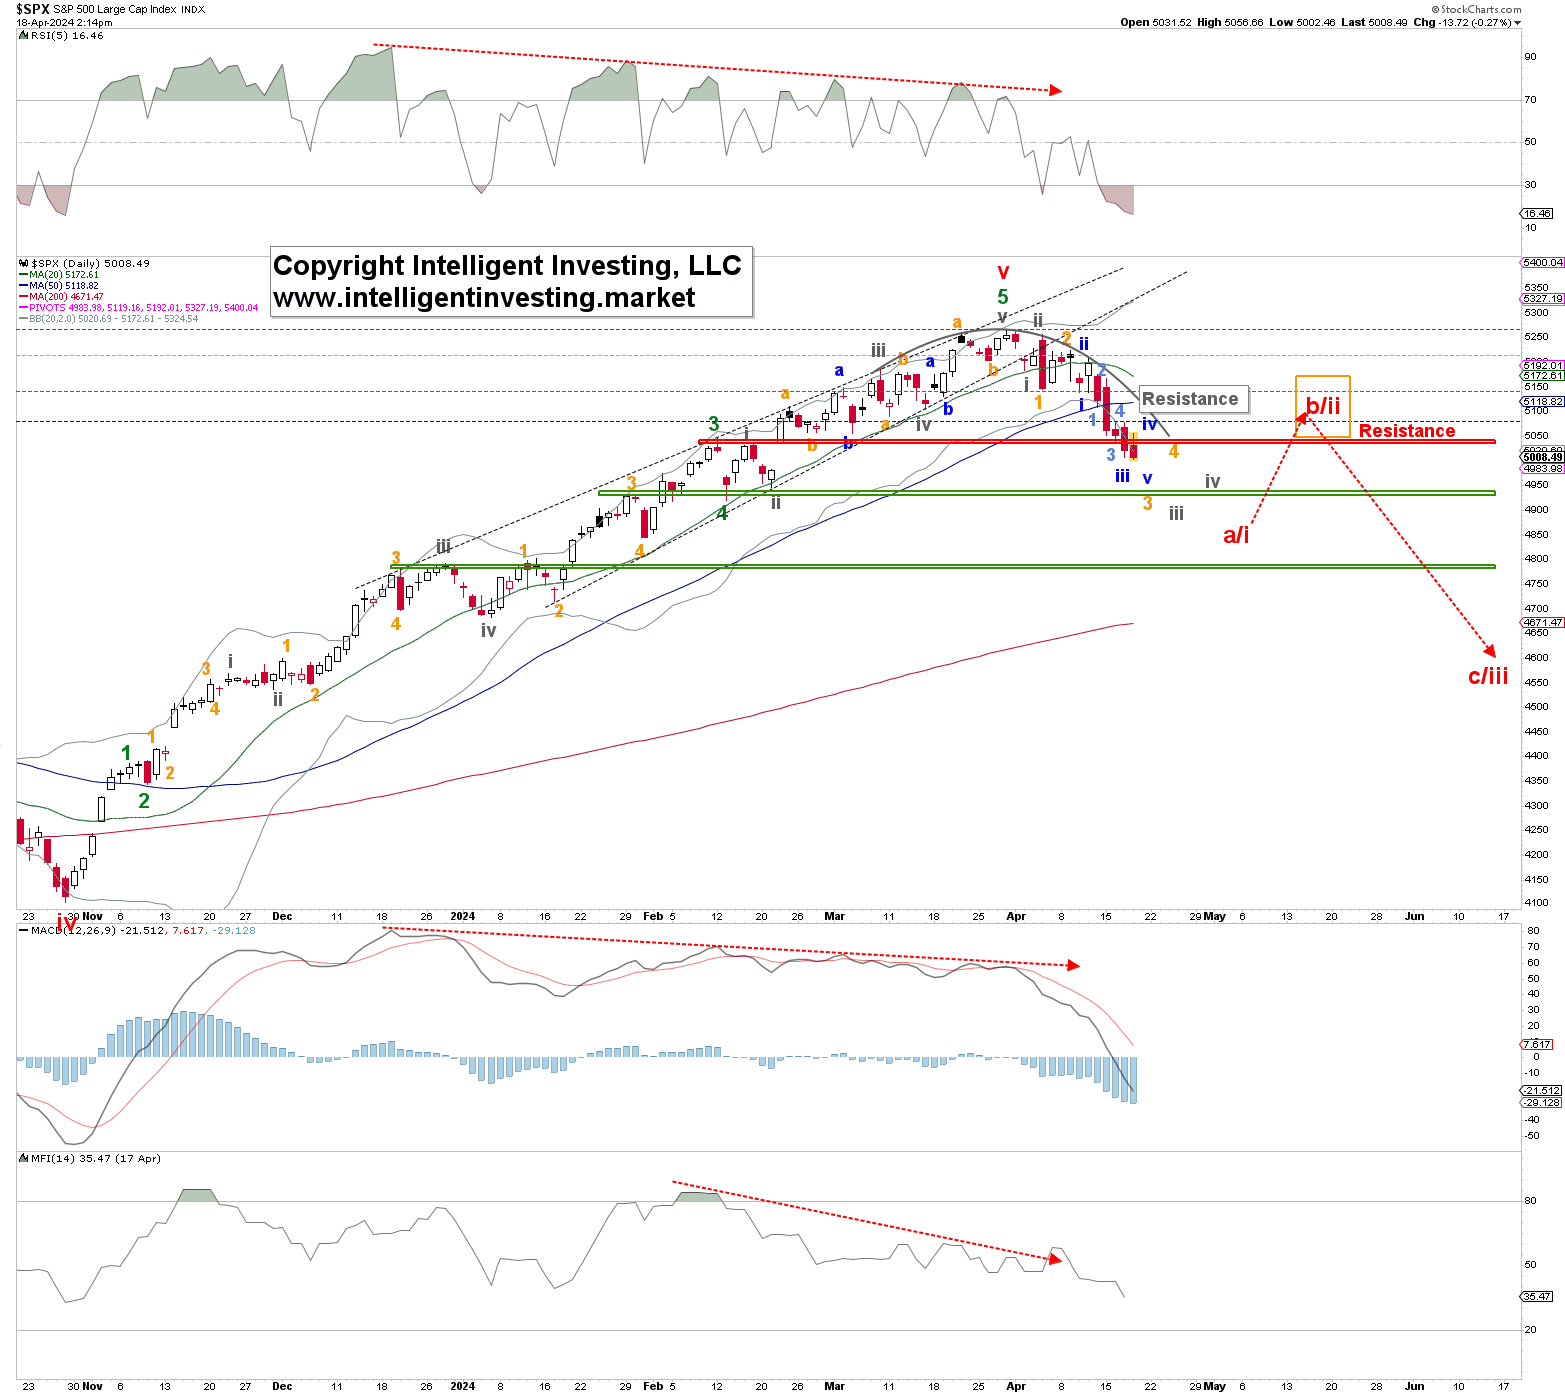
Recently, the S&P 500 failed to exceed the peak of $5264.85 from March 28. It has since fallen below key levels at $5100 and $5056. This validates our forecast of a peak around $5260, conditional on sustaining key lower thresholds. We now observe a potential downward five-wave pattern targeting $4800 in the near term, potentially followed by a rebound, dependent on the index staying below bearish thresholds.
Figure 1: Daily S&P 500 Chart with EWP Details and Indicators
The possibility of a significant peak is highlighted in additional charts:
Figure 2: Monthly S&P 500 Chart with EWP Details and Indicators
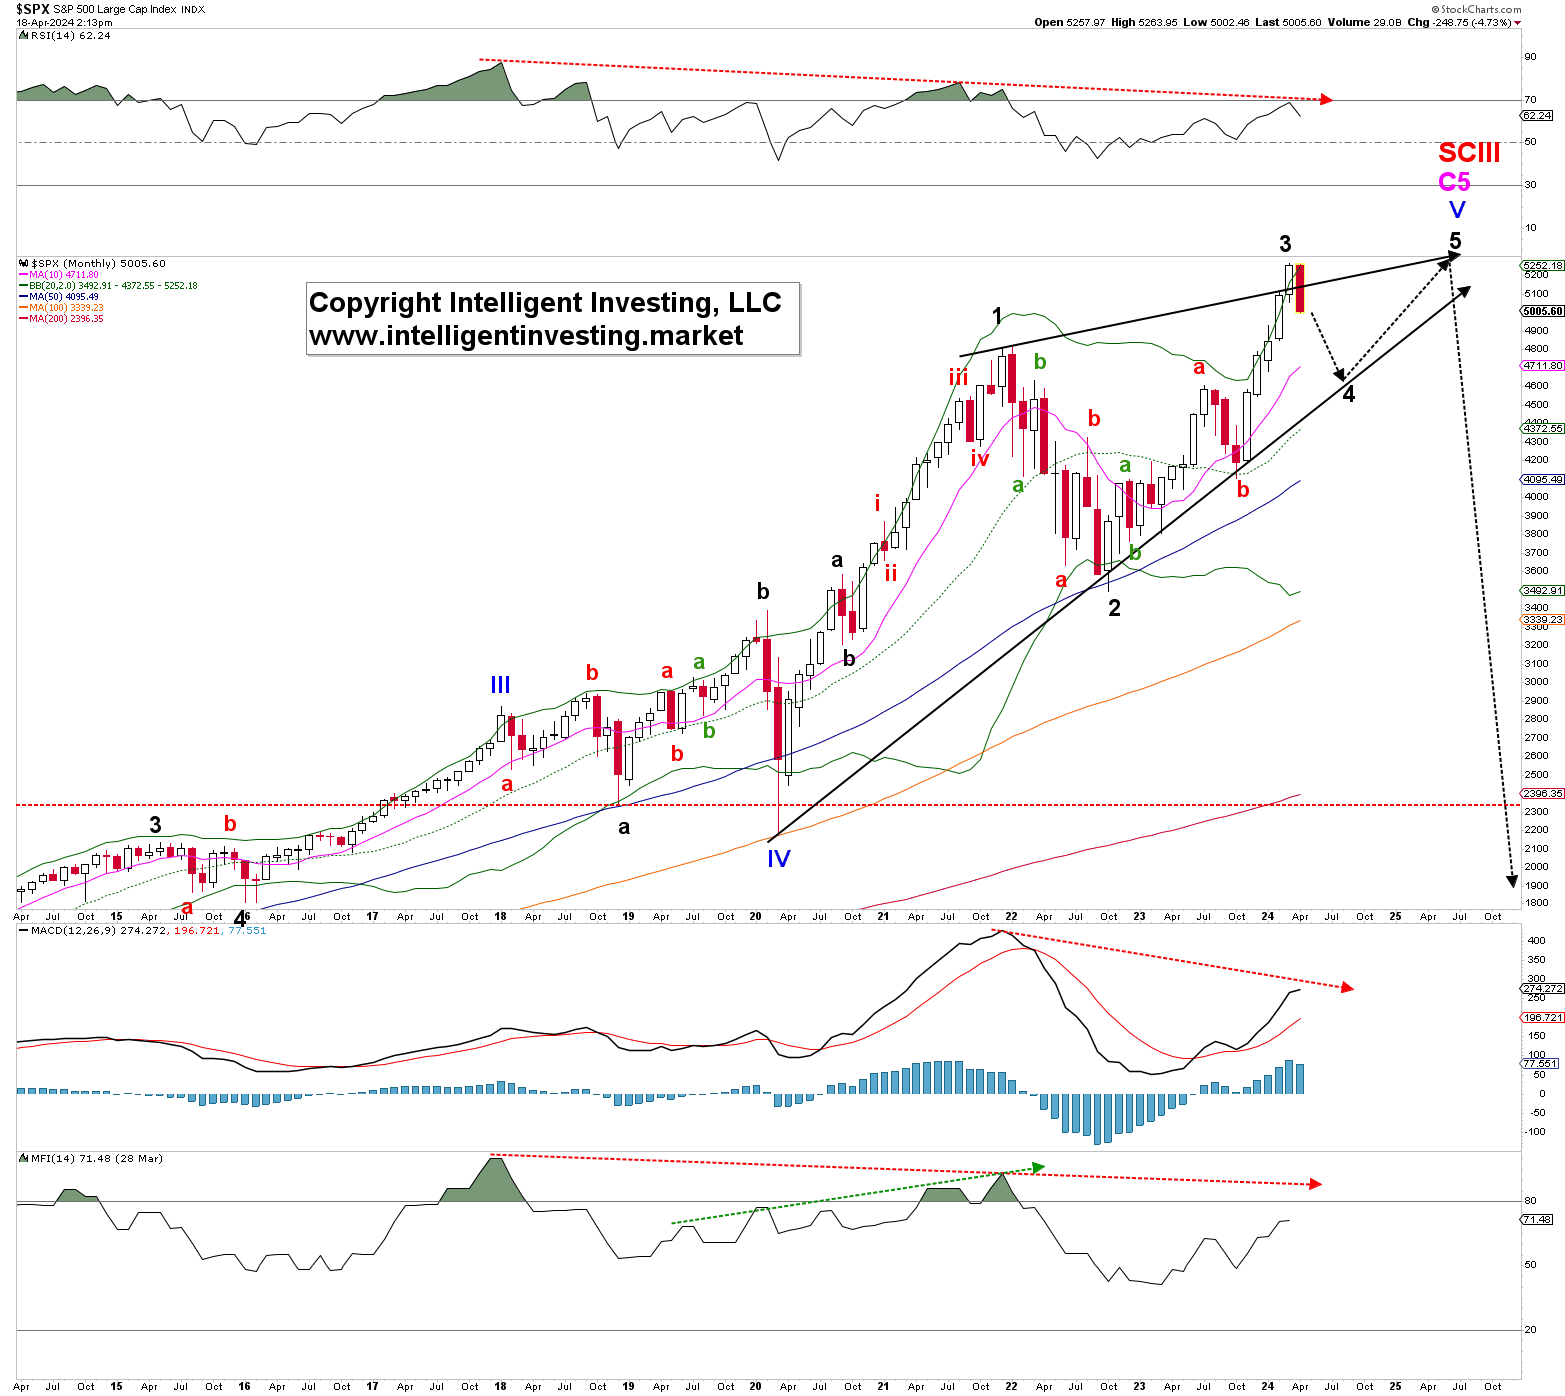
This scenario suggests a possible drop to $4600 before a final surge to around $5800. Alternatively, the index might have commenced a prolonged bear market post-1933 bull run, potentially reducing its value to nearly $1500.
Figure 3: Weekly S&P 500 Chart with EWP Details and Indicators
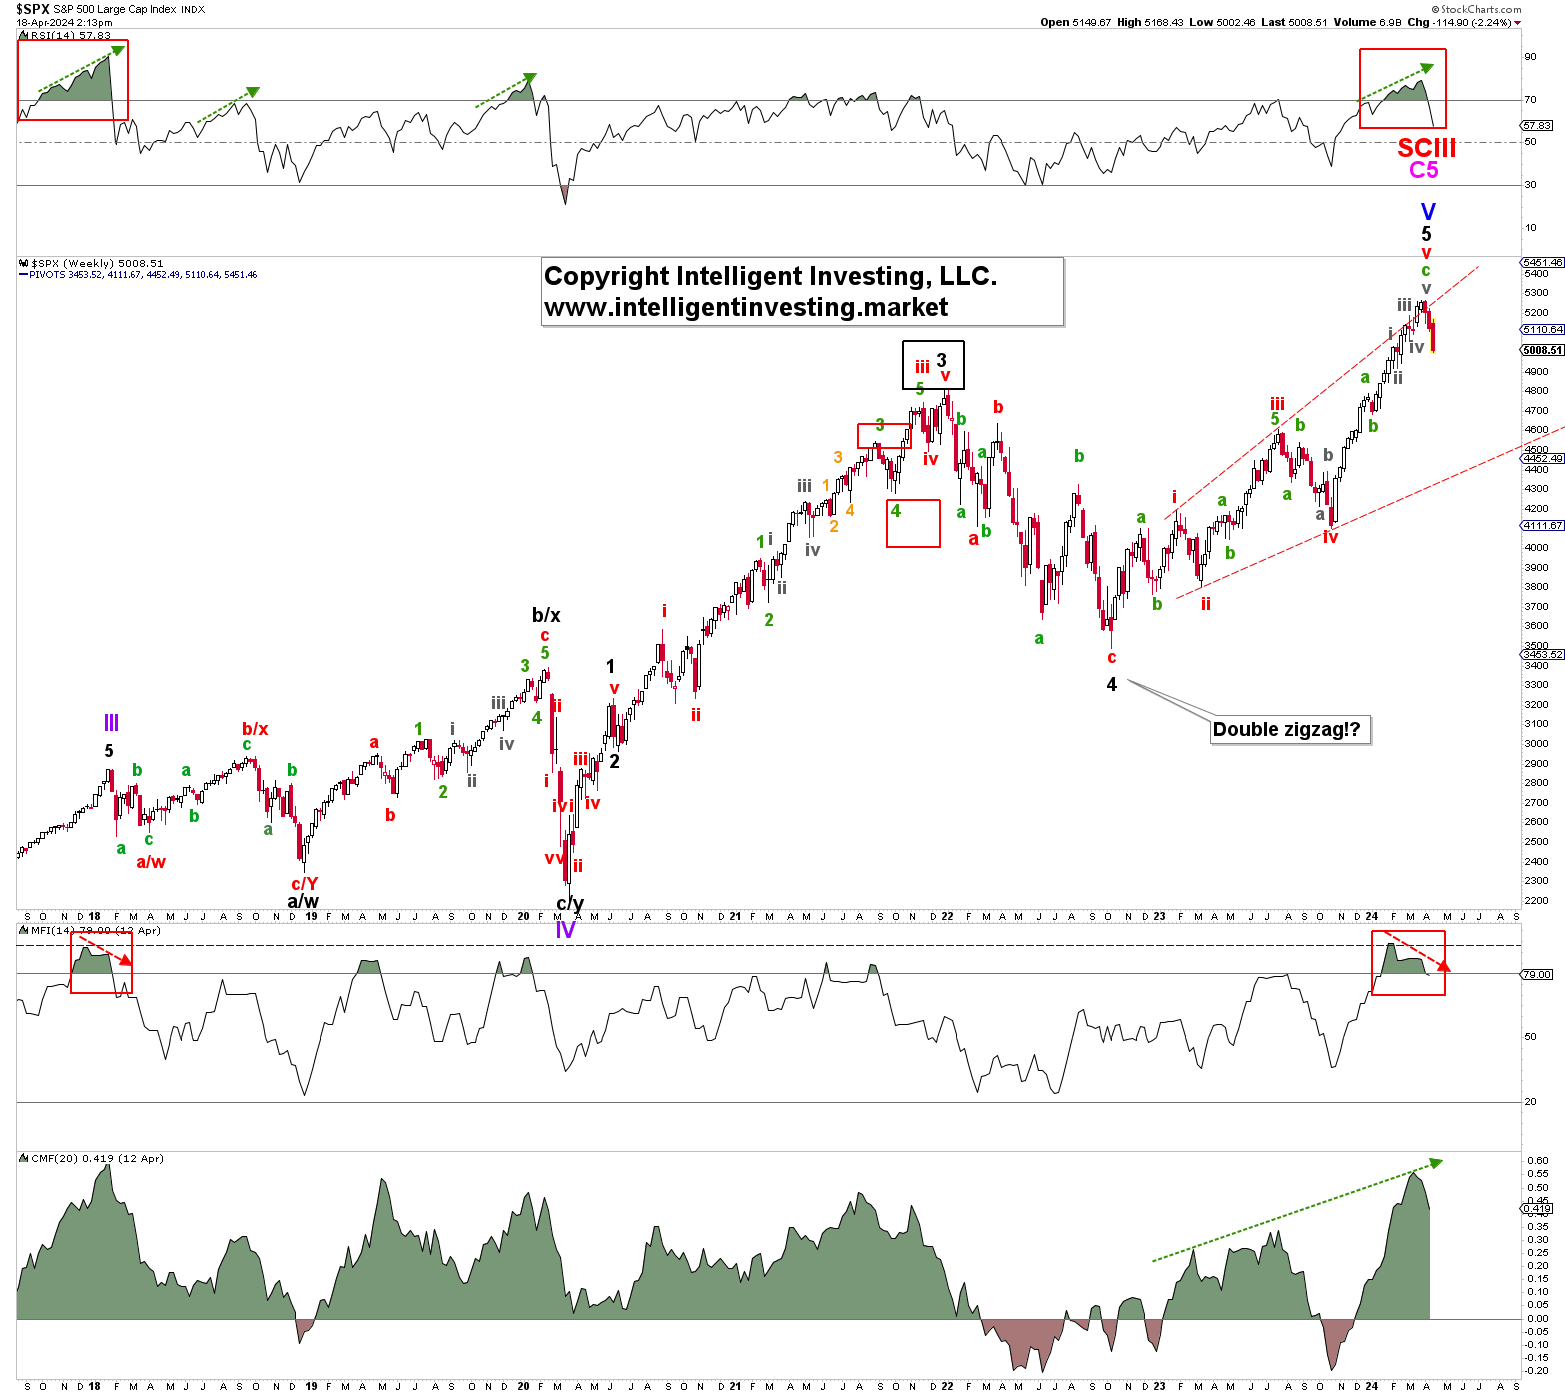
Current weekly indicators mimic late 2017 dynamics, suggesting potential short-term gains similar to 2018. However, negative divergences in monthly indicators indicate these gains might be limited.
Conclusion
While it’s too early to confirm which scenario will unfold, the developing impulse pattern may tilt the scales toward a deeper bear market. We remain vigilant, monitoring these pivotal movements closely.