

Want to jump straight to the answer? The best forex broker for traders is Avatrade
The #1 Forex Trading Course is Asia Forex Mentor
As part of the foresight, the Crab pattern formation falls among the broader family of harmonics patterns. In our commitment to giving you the best actionable information, we make it our purpose to seek expert opinions.
Therefore, to enlighten us through the Crab pattern is Ezekiel Chew from Asia Forex Mentor. Ezekiel is, first of all, a successful trader with twenty years of trading in the financial markets.
In summary, this post will share the distinct features of the Crab pattern – it will help you distinguish it from the broader harmonic pattern family. Progressively, we’ll go over the bullish crab and the bearish crab. Plus, a unique formation – the deep crab pattern formation.
Of course, there’s a key section on the insightful ways to approach the trade setups arising from the Crab pattern. And lastly is the FAQ section.
What is Crab Pattern?

A crab pattern forms with 5-precise points. And the 5 points are a key occurrence across the broader harmonic patterns family.
Specifically, the Crab pattern is a reversal pattern, and its formation derives from key occurrences across Fibonacci ratios – which help confirm the validity of the formation with price direction.
Once traders are clear that the formation is a Crab pattern, it allows them to join into markets that are volatile. And it works best when approached with either entry from extremely lows or highs in prices.
Conventionally, the crab pattern is notable for 5 points whose labeling conforms to ordinary harmonic patterns: they are X, A, B, C, and D. From the conventional naming, the Crab pattern, therefore, gets the following price legs: XA, AB, BC, and CD in order of formation. However, the most prominent leg in a crab pattern is the leg CD which is usually a very sharp swing.
How to Identify the Harmonic Crab Pattern?

A keynote regarding the identification of harmonic patterns. And it’s the formation that adheres to specific Fibonacci ratios and retracements. These form the basis for the validity of the formation.
So next is a highlight of the extensions and retracements as regards the formation of a harmonic pattern. And specifically, in this case, the crab pattern.
- Crab leg AB forms as a retracement of leg XA. Specifically, the retracement falls within the range of 38.2% to 61.8%. Plus, the point B must sit at a position that is lower than the 0.618 Fibonacci retracement level.
- The Crab pattern – leg BC makes an extension within the ranges of as low as 38.2% but not more than 88.6% Fibonacci levels – this is concerning the leg AB.
- In the variations of occurrence of crab patterns, point C must never make an inflection lower or greater than point A.
- The Crab leg AB constantly forms as a reversal of the impulsive leg XA (swing high).
- The Crab pattern leg CD forms as a reversal of leg BC. And specifically, it takes the Fibonacci ratios of a range 2of 24.0% to as high as 361.8% of the leg swing BC. In addition, the extent of the reversal, at longest, comes to 161.8% with respect to the price swing XA.
Crab patterns should not be mistaken for the butterfly pattern or the bat pattern. Well, both of them are within the harmonic pattern family. Yet, if you make a visual comparison between the Crab and the Butterfly – the crab has a distinct and more elongated extension of the leg BC.
D points on the Crab pattern formations get referred to as potential reversal zone. And it’s because price reversal appears once the price approaches the zones within the formation.
Bullish Crab Pattern

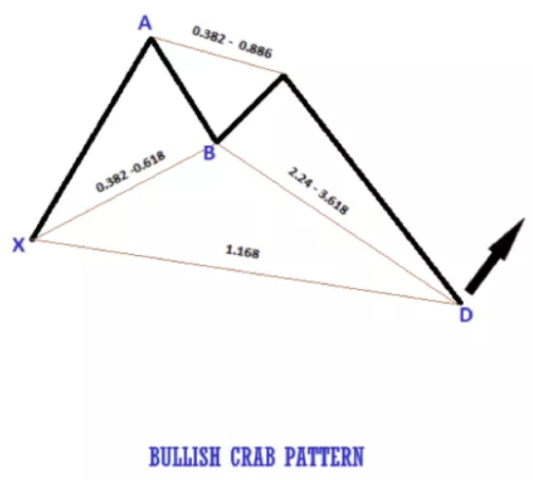
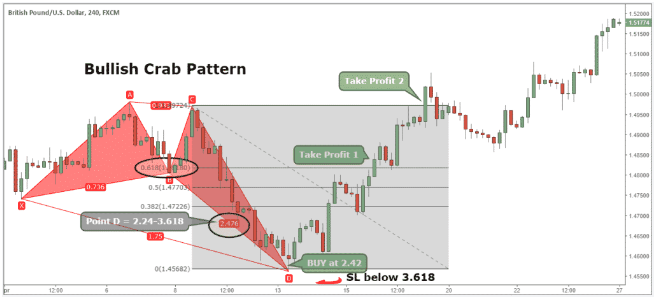
In the figure above, you can see a typical bullish crab harmonic pattern. And as part of the verification of the structure and its validity, it has met the requirements of the set harmonic Fibonacci levels.
Four Legs – Valid structure of a Crab harmonic pattern
- Swing or leg XA – Forms the initial swing in price movements for a Crab pattern, right from the point X to the point A. It’s a clear sweep. When prices rest at point A, it marks the highest level within the formation.
- Swing or Leg AB – takes the form of a retracement following the impulse move XA. As you can note from the figure, the prices retrace, but only to a portion of the impulse using XA. The retracement scores a 38.2% with respect to the initial swing XA. One other clear point is the B point – and specifically, for a crab pattern, the resting point of B is within price zones higher than the point X.
- Swing or Leg BC – In this phase or stage, the prices turn bullish again. However, it’s key to notice that the prices do not go or rise in the zone or region where point A rests. And for matter s of being specific, the extension of the point C, tracing from point A, falls within the range of not less than 38.2%, yet not more than 88.6%.
- Swing or Leg CD – This usually forms the fourth and the last swing of prices within the crab pattern formation. And specifically, prices turn bearish, falling all the way to the point D. The fall is usually steady. And within a crab pattern formation, the location of point D tracing from B usually extends within the ranges of not less the 224% but not more than 361.8%.
The D point is the zone of a potential reversal and is the region for traders to enter the best positions. And it should be subject to the volatility of prices, which can be checked with other indicators.
Of course, the target is to enter into a bullish breakout, should the prices take that course as per plan. Once a buy order goes into profit from point D, there are two critical potential levels of taking profits.
The probable level of taking profits within a crab pattern fall within the zones of point B and C. And it’s best to position on the way to lock profits should the markets reverse from anywhere within those two zones.
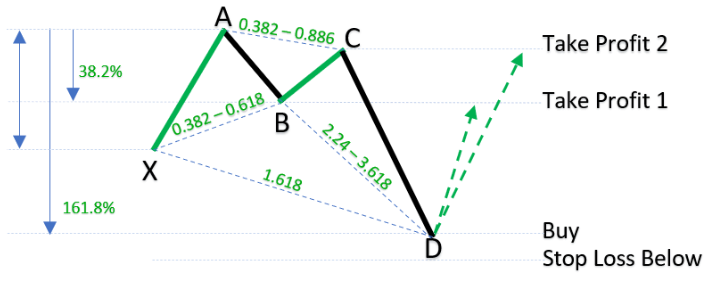
How the Bullish Crab Pattern is set up?

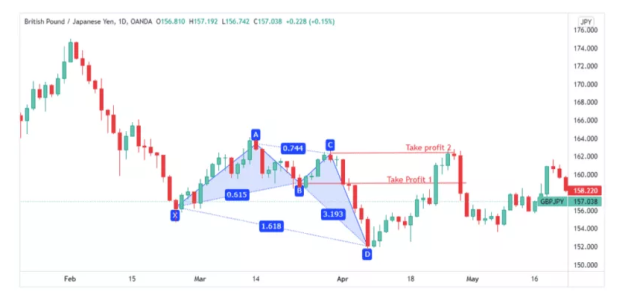
From our illustration above, we’ll review the setup of a bullish crab pattern appearing in the GBP/JPY currency pair on the daily charts. As you can see, the prices turn bullish right from the extreme point D.
Positions of an ideal entry with a Crab pattern fall within position D. The best way to confirm is using the Fibonacci ratio of 1.618. Plus, this should lie at price zones lower than point X (From the XA swing)
To be very specific, the best entry should allow for forming a green-bullish candle. On the chart, it’s ideal for joining into the bullish break at point D and price at152. 000. The entry is very clear, but how sure are we there’ll be a bullish breakout?
Ideally, cover your capital with a stop loss position. From our chart, the price point of 150.000 is a reasonable price to cover the capital. Trading that way optimizes the options to wait for a reversal at the D point while grappling with the best entry point to capture the upswing.
Regarding the take profit positions- we have two regions as the figure highlights. One is within the levels of point B, taken as taking profit level one. And second, is the one with the label – take profit 2 within the price zone marked C.
Of course, bullish breaks can rise way past the C zone, so to maximize the profits, cover the profit on the lower side with a stop loss position. Else, keep rising it as far as possible when a reversal hits the market.
How to Trade the Bullish Crab Pattern?

Market analysts and traders should bear in mind that there’s no special method to trade and profit from the Bullish crab pattern. However, the trading strategies should build on the insight that it is a reversal pattern and hence should be traded as counter moves within the price action.
The other essential note is that the bullish crab pattern helps traders when prices break into the uptrend, so it works with buy orders.
Also, regarding chances of occurrence, the crab harmonic pattern appears with highly volatile markets. As such, it’s more important to use a keen strategy that is very sharp on the entry into the markets.
Ideally, it’s to jump in as markets approach the D reversal point and reap from the reversal.
Of course, this should be within limits 161.8%., and taking profits appropriately within the region of B and C – whichever applies best.
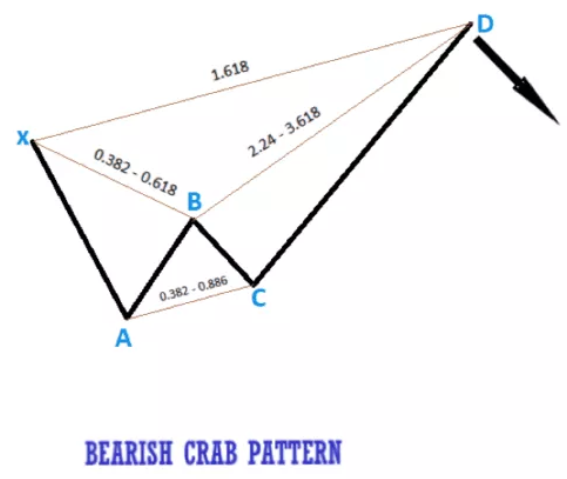
Bearish Harmonic Crab Pattern Explained

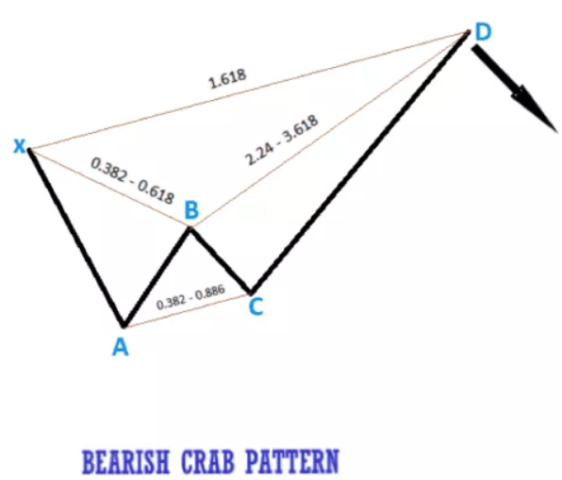
Bearish harmonic crabs are reversal patterns. There are no specific methods to trade the pattern -other than its insights.
Next, we’ll share trips once points D- potential reversal zones for the Bearish Crab pattern.
For the bearish Crab pattern, point D sits within the Fibonacci ratio of 161.8% of X – which is considered more. At extremes, the D point may sit between 224% to 361.8% of B.
Bearish Crab Pattern Setup

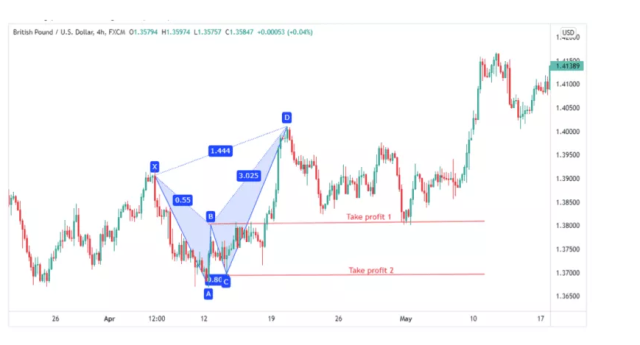
We’ll refer to the illustration above-GBPUSD currency pair on a 4 Hour chart to document an ideal way to analyze and pick high probability setups with the bearish crab pattern.
Ideally, it’s entering within point D and riding on a probable bearish price turn. In the image above, it’s best to place a stop above D, precisely at the price point of 1.40500.
Next are the two probable take profit regions: take profit 1 at region B and take profit 2 at region C. Of course, if prices dip past zone C, you are free to cover the profit with a stop and step to as lower as possible when a reversal happens.
The Deep Crab Pattern

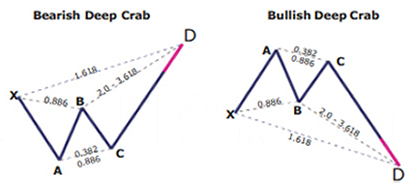
A deep crab harmonic pattern appears as a crab pattern, with a slight variation in Fibonacci levels for swing B. Specifically, a deep crab pattern shows a retracement of the point B going up to 88.6%. In typical crab patterns, the retracements fall between 38.2% and 61.8%.
And also, more uniquely, deep crab patterns comprise five swing points – not the ordinary four.
3 key Fibonacci levels to confirm deep crab harmonic price patterns
- B retraces 88.6% of the XA initial investment
- BC extends from 38.2% to 88.6% of AB
- CD reverses 161.8% of XA. And from 261.8% to 361.8% BC.
Finally, a bullish or bearish deep crab pattern harmonic trading is traded following rules as regular harmonic pattern crab.
Best Forex Trading Course


Asia Forex Mentor is one of the most credible forex trading courses available today. It is headed by Ezekiel Chew, a trader making six figures per trade for over a decade. The trading methods are backed by mathematical probability and the trainer behind banks and trading institutions.
AFM PROPRIETARY ONE CORE PROGRAM is the core program that covers from beginner to advanced, and every segment must include the above points. The program is designed to make you confident and earn as quickly as possible in live markets.
It starts with the basics of forex trading and moves on to more advanced topics such as risk management, market analysis, and trade execution. The course also includes a live trading session where you can see the techniques being applied in real-time. If you’re serious about learning forex trading, sign up now!


Best Forex Brokers


Conclusion: Harmonic Trading for Crab Pattern

Crab patterns form with key Fibonacci ratios, which help confirm whether it is a replica of the patterns. One peculiar point to note is that crabs are reversal patterns – which form the basis of traders’ strategies and technical indicators to approach the markets.
As with many patterns, most trading strategies approach by sporting the probable reversal point D, working with reasonable stop loss, and planning to break into either – a bullish or bearish crab formation.
Lastly, it’s best to pay attention to the formation to verify its indeed a crab pattern. Most trading platforms have scanners to help traders spot the precise harmonic pattern. And, of course, once verification is done, it’s time to plan market entry and exit.
Harmonic Crab Pattern FAQs
Is Crab Harmonic Patterns profitable?
The crab pattern is profitable if used correctly. And this is so with most other harmonic patterns. Traders should approach it from the point of its occurrence – within highly volatile markets, and make entries within extreme lows or highs.
What do you need to trade the crab pattern?
Market analysts and traders need a harmonic scanner to help spot formations of the crab patterns.