

Want to jump straight to the answer? The best forex broker for traders is Avatrade
The #1 Forex Trading Course is Asia Forex Mentor
If you are looking for a trading strategy that can be applied to all markets, the Bill Williams Oscillator Strategy is an excellent choice. It can trade various markets, including stocks, futures, and forex.
The Bill Williams Oscillator is a momentum indicator based on the fractal theory. Fractals are patterns within a market that can be used to predict future price movements. Its strategy is similar to the breakout Triangle strategy, providing entry signals when the momentum confirms the price shift action. Not only that, but it also offers insight into security's strengths or weaknesses.
The Awesome Oscillator trading strategy is a momentum indicator that may be used to verify trends or predict reversals. It achieves this by comparing the present market momentum to the overall trend indicators over a longer period. To better understand the Bill Williams Oscillator Strategy, we have got Ezekiel Chew, the founder of Asia Forex Mentor – one of the leading and successful forex education companies- to share his take on this trading strategy. We will discuss Bill Williams's Oscillator trading strategy, its calculation, how to use it, and much more. So, let's get started.
What is Bill Williams Oscillator Trading Strategy
Bill Williams, a well-known technical analyst, trader, and psychologist developed the Awesome Oscillator strategy indicator. He is also responsible for designing multiple commonly used trading tools. In fact, there's even a whole Bill Williams suite of signals available in Metatrader 4.
This indicator is different from other oscillators as it shows the market momentum in recent and historical volatility. This indicator focuses on momentum; the indicator is activated when it changes. This may frequently result in a price change shortly afterward. After all, if the momentum in a potential upward trend begins to slow down, it suggests that that financial asset has less interest. It usually leads to profit taking and even selling when the downward momentum slows down before buyers come in and pick up the market or simple short covering occurs.
However, it should not be confused with the Commodity Channel Index (CCI). The CCI measures market momentum and the current price activity by comparing it to previous periods of price action. This difference makes the Awesome Oscillator trading strategy more suitable for currency trading than other markets. This indicator assumes that market volatility will revert to its mean or average value over time. Therefore, as the market makes a violent move in one direction, it will likely move back towards the mean.
Bill Williams Oscillator Calculation

The Bill Williams Oscillator Calculation is done by taking the difference between 34 and 5-period Simple Moving Averages (SMAs) while considering the midpoint values of the closing price.
Here is what the Awesome oscillator formula looks like:
Midpoint value = (Bar high – Bar low) / 2
Awesome Oscillator = SMA 5- SMA34
The histogram bar color varies compared to the Awesome oscillator's initial value. Its color will be red if the current value is lower than the previous value. But, if the current value is higher than the previous, its color will be green.
Negative evaluations that exhibit bearish momentum will be shown as a histogram bar below the zero line, while positive valuations that demonstrate bullish momentum will be shown as a histogram bar above the zero line.
Significance of using Bill Williams Oscillator Indicator
The significance of the awesome oscillator compared to other indicators like the MACD is that, first and foremost, the Awesome Oscillator indicator is calculated with a median price, whereas the MACD line is based on closing prices.
As mentioned earlier, the Awesome Oscillator (AO) uses the 24 and 5-period simple moving averages. At the same time, the MACD indicator uses the 26-period and 12-period exponential moving averages along with the 9-period signal line.
Also, the exponential moving average captures market momentum while emphasizing recent price changes; the MACD is a more prominent indicator than the Awesome Oscillator indicator. It depicts that the MACD is a more effective long-term momentum indicator than the Awesome Oscillator, which was used in the past.
The MACD, on the other hand, is not always superior at determining momentum. The selection of momentum indicators is ultimately based on your trading style and the sort of trading setups you have available.
How to use Bill Williams Oscillator Indicator
As a trader, you must be familiar with the indicator and how the Awesome Oscillator is applied to charts before you start trading live. It means recognizing the histogram pattern representation as well as divergence trading methods. To determine how to stop loss levels, it is also important to grasp the fundamentals of support and resistance.
To start using the Awesome Oscillator indicator, there are several trading strategies, i-e, zero line crossover trading strategy, the awesome oscillator saucer trading strategy, and the twin peaks trading strategy.
Zero Line Crossover Trading Strategy
The zero-line crossover is one of the best trading strategies and is one of the simplest ways to use the Awesome Oscillator. As the name suggests, you buy or go long when the indicator crosses the zero line, and conversely, you sell or go short when it crosses below the zero line.
The main purpose of this strategy is to enter the market when there is a change in momentum. When the AO indicator crosses the zero line, it signals that the short-term momentum has changed from bearish to bullish. Vice versa, when it crosses below the zero line, it is an indication that the short-term momentum has changed from bullish or bearish forces.
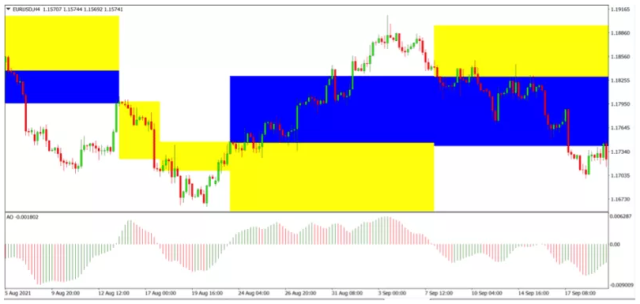
Awesome Oscillator Saucer Trading Strategy
The Awesome Oscillator saucer trading strategy is a bullish and bearish reversal pattern that signals a change or pause in the current momentum. This strategy is a three-bar pattern consisting of two consecutive red or green bars followed by a yellow bar. The first two bars identify the trend, while the third bar signals a change or pause in momentum.
The strategy can be used to enter a long or short position. To go long, you would wait for the histogram to print two consecutive green bars followed by a yellow bar. To go short, you would wait for the histogram to print two consecutive red bars followed by a yellow bar.
The Twin Peaks Trading Strategy
The twin peaks trading strategy is a bullish and bearish setup to signal a change in momentum. This strategy is a three-bar pattern consisting of two consecutive red or green bars followed by a yellow bar. The first two bars identify the trend, while the third bar signals a change or pause in momentum.
The strategy can be used to enter a long or short position. To go long, you would wait for the histogram to print two consecutive green bars followed by a yellow bar. To go short, you would wait for the histogram to print two consecutive red bars followed by a yellow bar.
Trading Bill Williams Oscillator Indicator
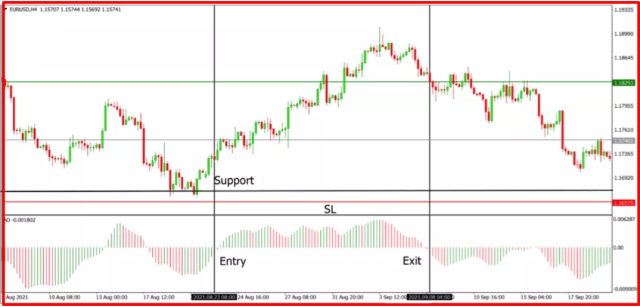
If you want to apply the zero line crossing over strategy, enter the trade on the first bar when the histogram crosses the zero line, as with other methods.
When the histogram passes the zero line for a bullish approach, you should enter the first green bar for a bullish position. However, in the case of the bear position, when the histogram crosses the zero line, enter the first red bar.
The exit signal is triggered when the histogram reaches the zero line of the opposing direction, just like the entry signal. The key support and resistance levels would be used to stop losses.
Pros and Cons of using Bill Williams Oscillator Indicator
Pros
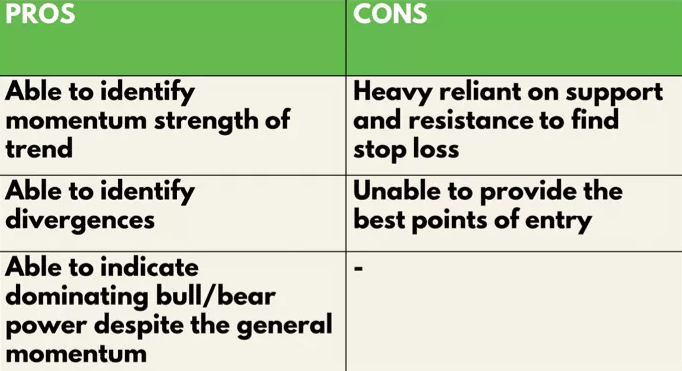
The advantage of using the awesome oscillator indicator is that it helps you enter the market early when there is a change in momentum. Also, it identifies the momentum strength of the trend and divergences.
Bill Williams oscillator can be used to trade both long and short positions. Moreover, it can indicate the financial markets dominate bull/bear power.
Cons
A major disadvantage of using this indicator is that it is lagging in nature, giving signals after the momentum has already started to change. Another thing to remember is that divergence is not always reliable and can often lead to false trading signals.
Moreover, its strategy relies on resistance and support to stop loss and cannot provide the best entry points.
Best Forex Traning Course

The best Forex trading course is the One Core Program from Asia Forex Mentor by Ezekiel Chew. While trading skills are lucrative, it may take you so long to grasp what works and what doesn't. It builds your skills from the viewpoint of a new trader with fear into an advanced trader working with strategies.
Your best option is a great course. Trainers and mentors are aware of what will help you conquer the markets. Fumbling alone can waste your chance at a lifetime career in trading. A course helps you fast-track on a tried and tested model.
Many traders make a final stop at the One Core Program. Which is among the top ten credible courses you can bank on? Traders go on to hit six-figure trades following a proven model. It's a course that has helped retail and institutional traders transform their trading careers.


Best Forex Brokers
Conclusion: Bill Williams Oscillator Indicator
The Bill Williams oscillator is a powerful momentum indicator that can trade various strategies. It is best suited for experienced traders familiar with technical analysis and can interpret the trading signals correctly.
However, it is important to remember that this indicator lags in nature and can often give false signals. Also, achieving a good risk-to-reward ratio or finding an entry into the market is not the best.
Bill Williams Oscillator is reliable regarding profitability and wins rate as it provides flexibility to trade long and short positions. While it is a great addition to any technical trader's toolbox, remember to use it with other indicators to make more informed trading decisions.
Bill Williams Oscillator Indicator FAQs
Is the Bill Williams Oscillator better than MACD?
The MACD is a lagging indicator that signals after the momentum have already started to change. On the other hand, the Bill Williams oscillator is a leading indicator that can signal before the momentum starts to change.
What is the Bill Williams Oscillator Saucer Strategy?
The Bill Williams oscillator saucer strategy is a strategy that uses the histogram to enter and exit trades. The main idea behind this strategy is to buy when the histogram crosses the zero line from below and to sell when the histogram crosses the zero line from above.

